You can use expressions in the control's properties to calculate values. You can also use expressions to concatenate fields, to concatenate strings with fields, to aggregate data, to set formatting based on field values, to show or hide other controls based on field values and even to display a graphical representation of the data. This topic illustrates the how to use expressions to achieve different effects.
- This topic uses the MovieProduct table from the Reels database. The Reels.mdb file can be downloaded from GitHub: ..\Samples14\Data\Reels.mdb.
- Although this topic uses Page reports, you can also implement this using RDL reports.
When you complete these steps, you get a layout that looks similar to the following at design time and at run time.
Design-Time Layout
Using Expressions in report at design time
Run-Time Layout
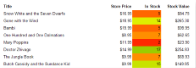
Using Expressions in report at run time
Add an ActiveReport to the Visual Studio project
- Create a new Visual Studio project.
- From the Project menu, select Add New Item.
- In the Add New Item dialog that appears, select ActiveReports 14 Page Report and in the Name field, rename the file as rptExpressions.
- Click the Add button to open a new fixed page report in the designer.
See Quick Start for information on adding different report layouts.
Connect the report to a data source
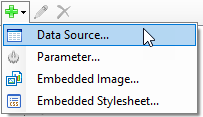
- In the Report Explorer, right-click the Data Sources node and select the Add Data Source option or select Data Source from the Add button.
- In the Report Data Source Dialog that appears, select the General page and in the Name field, enter a name like ReportData.
- On this page, create a connection to the Reels database. See Connect to a Data Source for information on connecting to a data source.
Add a dataset
- In the Report Explorer, right-click the data source node and select the Add Data Set option or select Data Set from the Add button.
- In the DataSet Dialog that appears, select the General page and enter the name of the dataset as DVDStock. This name appears as a child node to the data source icon in the Report Explorer.
- On the Query page of this dialog, in the Query field enter the following SQL query.
SQL Query Copy CodeSELECT * FROM DVDStock
- Click the Validate DataSet icon
 at the top right hand corner above the Query box to validate the query.
 - Click OK to close the dialog. Your data set and queried fields appear as nodes in the Report Explorer.
Create a layout for the report
- From the toolbox, drag a Table data region onto the design surface and go to the Properties Window to set the DataSetName property to DVDStock.
- Right-click in the column handle at the top of the third column and choose Insert Column to the Right to add a fourth column of the same width.
- Click inside the table to display the row and column handles along the left and top edges of the table and set the column width as follows:
Table Column Width TableColumn1 3.5in TableColumn2 1in TableColumn3 1in TableColumn4 1in - In the Report Explorer from the DVDStock dataset, drag the following fields into the detail row and set their properties as follows.
Data Field Column Name TableColumn1 Title TableColumn2 StorePrice TableColumn3 InStock - Select detail row cell containing the StorePrice values in the TableColumn2 and in the Properties Window, set the Format property to Currency.
- Select the header row using the row handle to the left and in the Properties Window, set the FontWeight property to Bold.
- For an Page report, in the Report Explorer select the Table control and in the Properties window, set the FixedSize property to 6.5in, 7in.
Add a field expression to a text box to multiply two field values
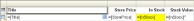
- In the detail row of the fourth column, enter the following expression:
= Fields!InStock.Value* Fields!StorePrice.Value - Go to the Properties Window to set the Format property of the textbox to Currency formatting.
- In the header row immediately above this Textbox, enter Stock Value for the static label.
Add an Immediate If expression to show or hide a report control
- Select the cell in which we multiplied two field values (in the detail row of the fourth column) and in the Properties window, expand the Visibility property.
- In the Hidden property, enter the following immediate if expression to hide the textbox if there is no stock for the item.
=iif(Fields!InStock.Value=0, True, False)
Add a Data Visualization expression to display data graphically
The ColorScale3 visualizer function displays a range of colors to indicate minimum, average, and maximum values in the data. See the Data Visualizers topic for further information.
Select the cell in the detail row under the In Stock label and in the Properties window, set the BackgroundColor property to the following expression: =ColorScale3(Fields!InStock.Value, 0, Avg(Fields!InStock.Value), Max(Fields!InStock.Value),
"Red", "Yellow", "Green")
View the report
- Click the preview tab to view the report at design time.
OR
- Open the report in the Viewer. See Windows Forms Viewer for further information.