ActiveReports 14 .NET Edition
ActiveReports 14 User Guide / Concepts / Section Report Concepts / Section Report Toolbox / Chart / Chart Appearance / Chart Control Items / Markers
In This Topic
    Markers
    In This Topic

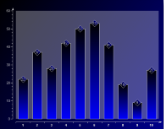
    Use markers to show specific data series values in a chart. Markers are created by setting the Marker property of the series.

    Using Markers in a Chart

    Using Markers in a Chart

    The following code demonstrates how to create a marker object at run time and assign it to the Marker property of the Series object. The results are shown in the image above.

    To write code in Visual Basic.NET

    Visual Basic code. Paste INSIDE the section Format event
    Copy Code
    ' create the marker object
    Dim marker1 As New GrapeCity.ActiveReports.Chart.Marker
    
    ' set the marker properties.
    marker1.Backdrop = New Chart.Graphics.Backdrop(Chart.Graphics.GradientType.Horizontal, Color.Navy, Color.Black)
    marker1.Line = New Chart.Graphics.Line(Color.White)
    marker1.Label = New Chart.LabelInfo(New Chart.Graphics.Line(Color.Transparent, 0, Chart.Graphics.LineStyle.None),
    New Chart.Graphics.Backdrop(Chart.Graphics.BackdropStyle.Transparent, Color.White, Color.White,
    _ Chart.Graphics.GradientType.Vertical, System.Drawing.Drawing2D.HatchStyle.DottedGrid, Nothing,
    _Chart.Graphics.PicturePutStyle.Stretched),
    New Chart.FontInfo(Color.White, New Font("Arial", 8.0F)), "{Value}", Chart.Alignment.Center) marker1.Size = 24 marker1.Style = Chart.MarkerStyle.Diamond ' assign the marker to the series Marker property Me.ChartControl1.Series(0).Marker = marker1

    To write code in C#

    C# code. Paste INSIDE the section Format event
    Copy Code
    // create the marker object
    GrapeCity.ActiveReports.Chart.Marker marker1 = new GrapeCity.ActiveReports.Chart.Marker();
    
    // set the marker properties
    marker1.Backdrop = new GrapeCity.ActiveReports.Chart.Graphics.Backdrop(GrapeCity.ActiveReports.Chart.Graphics.GradientType.Horizontal,
    System.Drawing.Color.Navy, System.Drawing.Color.Black); marker1.Line = new GrapeCity.ActiveReports.Chart.Graphics.Line(System.Drawing.Color.White); marker1.Label = new GrapeCity.ActiveReports.Chart.LabelInfo(new GrapeCity.ActiveReports.Chart.Graphics.Line
    (System.Drawing.Color.Transparent, 0, GrapeCity.ActiveReports.Chart.Graphics.LineStyle.None), new GrapeCity.ActiveReports.Chart.Graphics.Backdrop(GrapeCity.ActiveReports.Chart.Graphics.BackdropStyle.Transparent,
    System.Drawing.Color.White, System.Drawing.Color.White, GrapeCity.ActiveReports.Chart.Graphics.GradientType.Vertical, System.Drawing.Drawing2D.HatchStyle.DottedGrid, null, GrapeCity.ActiveReports.Chart.Graphics.PicturePutStyle.Stretched),
    new GrapeCity.ActiveReports.Chart.FontInfo(System.Drawing.Color.White, new System.Drawing.Font("Arial", 8F)),
    "{Value}", GrapeCity.ActiveReports.Chart.Alignment.Center);
    marker1.Size = 24;
    marker1.Style = GrapeCity.ActiveReports.Chart.MarkerStyle.Diamond; // assign the marker to the series Marker property this.ChartControl1.Series[0].Marker = marker1;
    See Also