Many a time, we need to display varied data from different datasets into one data region. This is now possible by using the Lookup function in a data region.
The Lookup function returns a value corresponding to a related or a common field with the same data type in another data set. It is set as an expression in the Value property of a data region's Textbox. The Lookup function in ActiveReports is similar to the Microsoft Excel's VLOOKUP.
Lookup Function
Syntax
=Lookup(<SourceExpression>, <DestinationExpression>, <ResultExpression>, <LookupDataset>)
Parameters
- Comparison Criteria: To compare the fields in the Source and the Lookup datasets. The criterion uses only the "=" operator.
- SourceExpression: An expression evaluating to a value from the dataset associated with the data region. If this expression is a FieldName, then the value of the Field from the dataset associated with the data region is used.
- DestinationExpression: An expression evaluating to a value from the dataset associated with the LookupDataset. If this expression is a FieldName, then the value of the Field from the dataset of the LookupDataset is used.
- ResultExpression: An expression evaluating to the Field from the LookupDataset returned by the Lookup function.
- LookupDataset: The dataset where the value from the data region's dataset is used to display the related attribute.
Usage
- The data type of the SourceExpression and the DestinationExpression should be same.
- When the Lookup function is used as a value expression in a data region, the expression is evaluated for each row or repeated data of the data region's dataset.
- The Lookup function returns one value if found, and null if no rows are found in the Lookup dataset.
- The Lookup expressions can be a part of aggregated expressions. A user can use the Lookup function in a table group or table header or footer, and sum all values for the table.
Limitations
- Only "=" comparison is supported between SourceExpression and DestinationExpression.
- Non-aggregate expressions such as multiply, mod, AND and OR, are not allowed in the comparison criteria.
- Only one level of Lookup is allowed, that is, nested Lookup functions are not supported.
This walkthrough explains the steps involved in using multiple datasets in a data region. The walkthrough is split into the following activities:
- Adding an ActiveReport to a Visual Studio project
- Connecting the report to a data source
- Adding the datasets
- Adding controls to the report
- Viewing the report
- This walkthrough uses the SalesResult database. The SalesResult.mdb file can be downloaded from GitHub: ..\Samples14\Data\SalesResult.mdb.
- Although this walkthrough uses Page reports, you can also implement this using RDL reports.
When you complete this walkthrough you get a layout that looks similar to the following at design time and at run time.
Design-Time Layout
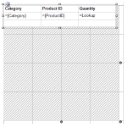
Using multiple datasets in a data region at design time
Run-Time Layout
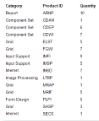
Using multiple datasets in a data region at run time
To add an ActiveReport to the Visual Studio project
- Create a new Visual Studio project.
- In the New Project dialog that appears, select ActiveReports 14 Page Report Application and in the Name field, rename the file as SalesResultReport.
- Click OK to create a new ActiveReports 14 Page Report Application. By default a Page report is added to the project.
See Quick Start for information on adding different report layouts.
To connect the report to a data source
- In the Report Explorer, right-click the Data Sources node and select the Add Data Source option or select Data Source from the Add button.
- In the Report Data Source Dialog that appears, select the General page and in the Name field, enter a name like SalesResultData.
- On this page, create a connection to the SalesResult database. See Connect to a Data Source for information on connecting to a data source.
To add the datasets
To add Dataset1
- In the Report Explorer, right-click the data source node and select the Add Data Set option or select Data Set from the Add button.
- In the DataSet Dialog that appears, select the General page and let the name of the dataset be Dataset1. This name appears as a child node to the data source icon in the Report Explorer.
- On the Query page of this dialog, in the Query field enter the following SQL query.
SQL Query Copy CodeSELECT M01Product.Category, M01Product.ProductID FROM M01Product
- Click the Validate DataSet icon
 at the top right hand corner above the Query box to validate the query.
 - Click OK to close the dialog. Your data set and queried fields appear as nodes in the Report Explorer.
The Dataset1 contains following fields:
- Category
- ProductID
To add Dataset2
- Repeat Steps 1 and 2 to add another dataset with name Dataset2.
- On the Query page of this dialog, in the Query field enter the following SQL query.
SQL Query Copy CodeSELECT * FROM T01Result
- Click the Validate DataSet icon at the top right hand corner above the Query box to validate the query.
- Click OK to close the dialog. Your data set and queried fields appear as nodes in the Report Explorer.
The Dataset2 contains following fields:
- ID
- ProductID
- Quantity
- PDate
- FY
To add controls to the report
- From the toolbox, drag a Table data region onto the design surface of the report.
- Go to the Properties Window to set the properties of Table data region as follows:
Property Name Property Value FixedSize 4in, 4in Location 0in, 0in Size 3.875in, 0.75in DataSetName Dataset1 - Hover your mouse over the text boxes of the Table Details row to access the field selection adorner and set the following fields in the table cells along with their properties.
This automatically places an expression in the details row and simultaneously places a static label in the header row of the same column.Cell Field TextBox4 Category TextBox5 ProductID -
Select TextBox6 of the Table data region and from the Properties pane, set the following properties:
Property Name Property Value Value =Lookup(Fields!ProductID.Value, Fields!ProductID.Value, Fields!Quantity.Value, "DataSet2") TextAlign Left The expression in the Value property returns the value of Quantity from Dataset2, corresponding to the related data field ProductID in Dataset1.
- Select TextBox3 of the Table data region and from the Properties pane, set the following properties:
Property Name Property Value Value Quantity TextAlign Left - Select the header row using the row handle to the left and in the Properties Window, set the FontWeight property to Bold.
To view the report
- Click the preview tab to view the report at design time.
OR
- Open the report in the Viewer. See Windows Forms Viewer for further information.