Using parameters you can connect your report to the chart control. By setting the parameter on the field that connects the report to the chart, the report passes the data to display in the chart. This walkthrough illustrates how to link report with chart using parameters.
The walkthrough is split up into the following activities:
- Adding an ActiveReport to a Visual Studio project
- Connecting the report to a data source
- Adding controls to the report to display data
- Connecting the Chart control to a data source using parameter
- Setting the Chart's properties
- Viewing the report.
When you complete this walkthrough you get a layout that looks similar to the following at run time:
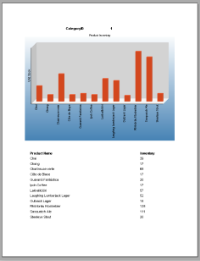
Using Paramters for Chart at Run Time
To add an ActiveReport to the Visual Studio project
- Create a new Visual Studio project.
- From the Project menu, select Add New Item.
- In the Add New Item dialog that appears, select ActiveReports 14 Section Report (code-based) and in the Name field, rename the file as rptChartParams.
- Click the Add button to open a new section report in the designer.
See Quick Start for information on adding different report layouts.
To connect the report (rptChartParams) to a data source
- On the detail section band, click the Data Source Icon.
- In the Report Data Source dialog that appears, from the OLE DB tab, create a data source connection. See Bind Reports to a Data Source for further details.
- Once the connection string field is populated, in the Query field, enter the following SQL query.
SQL Query Copy CodeSELECT * FROM Products ORDER BY CategoryID, ProductName - Click OK to save the data source and return to the report design surface.
To add controls to the report to display data
- On the design surface, right click the PageHeader or PageFooter section and select Delete to remove the PageHeader/Footer pair.
- Right click on the design surface and insert GroupHeader/Footer section pair.
- Click the GroupHeader section to select it and go to the Properties window to set the following properties:
Property Name Property Value Name ghCategoryID DataField CategoryID GroupKeepTogether All Height 5.65 inches - Set Height property of Detail section to 0.23 inches and of GroupFooter section to 0 inch.
- From the Visual Studio toolbox, drag and drop the following controls onto the GroupHeader section and set their properties as given below:
Label1
Property Name Property Value Name lblCategoryID Text CategoryID Location 1.78, 0 Label2
Property Name Property Value Name lblProductName Text Product Name Location 0.23, 5.43 Label3
Property Name Property Value Name lblUnitsInStock Text Inventory stock Location 5, 5.43 TextBox
Property Name Property Value DataField CategoryID Name txtCategoryID Text CategoryID Location 3.72, 0 Chart
Property Name Property Value Name ChartControl Location 0, 0.313 Size 6.5, 4.66 - From the Visual Studio toolbox, drag and drop the following controls onto the detail section and set their properties as given below:
TextBox1
Property Name Property Value DataField ProductName Name txtProductName Text ProductName Location 0.23, 0 TextBox2
Property Name Property Value DataField UnitsInStock Name txtUnitsInStock Text UnitsInStock Location 5, 0
To connect the Chart to a data source
- Select the Chart control and at the bottom of the Properties window, select the Data Source command. See Properties Window for further details on accessing commands.
Tip: If the verb is not visible, right-click an empty space in the Properties Window and select Commands to display verbs.
- In the Chart DataSource dialog box that appears, click the Build button.
- In the Data Link Properties window, select Microsoft Jet 4.0 OLE DB Provider and click the Next button.
- Click the ellipsis button (...) to browse to the NorthWind database. Click Open once you have selected the file.
- Click the OK button to close the window and fill in the Connection String.
- In the Query field, enter the following parameterized SQL query.
SQL Query Copy CodeSELECT * FROM Products WHERE CategoryID = <%CategoryID||1%> ORDER BY ProductName Note: The chart data cannot be arranged if ORDER is not set in both the SQL statements (report and chart statement). - Click OK to save the data source.
To configure the appearance of the Chart
- With the chart control selected, go to the Properties window, click the ChartAreas (Collection) property and then click the ellipsis button that appears.
- In the ChartArea Collection Editor that appears with defaultArea selected under the members list, click its Axes (Collection) property and then click the ellipsis button.
- In the AxisBase Collection Editor that appears, set the following properties.
AxisBase
- With AxisX selected under members list, set Angle property of LabelFont to -90.
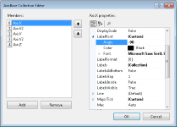
AxisBase Collection Editor
- Delete text from Title property to make sure that the ProductName label (lblProductName) does not overlap.
- Click AxisY under the members list and set its Title property to Unit Stock.
- With AxisY selected under the members list, expand the GridLine section under MajorTick property tree view and set its following sub-properties.
Property Name Property Value Style Dot Color Silver Weight 1
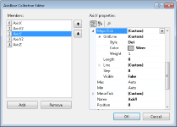
AxisBase Collection Editor
- Click OK to return back to ChartArea collection editor and then click OK again to return back to report design surface.
- With AxisX selected under members list, set Angle property of LabelFont to -90.
- With the chart control selected, go to the Properties window, click the ChartSeries (Collection) property and then click the ellipsis button that appears.
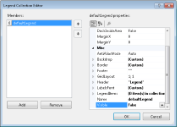
- In the Series Collection Editor that appears, set the following properties:
Series
- With Series1 selected under the members list, set its following properties:
Property Name Property Value ValueMembersY UnitsInStock ValueMembersX ProductName
Series Collection Editor
- Click OK to return back to report design surface.
- With Series1 selected under the members list, set its following properties:
- With the chart control selected, go to the Properties window, click the Titles (Collection) property and then click the ellipsis button that appears.
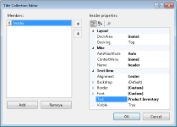
- In the Title Collection Editor that appears, set the following properties:
Titles
- With Header selected under the members list, set its Text property to Product Inventory.
Title Collection Editor
- Delete/Remove Footer from the members list.
- Click OK to return back to report design surface.
- With Header selected under the members list, set its Text property to Product Inventory.
- With the chart control selected, go to the Properties window, click the Legends (Collection) property and then click the ellipsis button that appears.
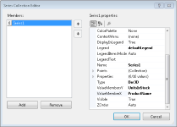
- In the Legend Collection Editor that appears, set the following properties:
Legends
- With defaultLegend selected under the members list, set its Visible property to False.
Legend Collection Editor
- Click OK to return back to report design surface.
- With defaultLegend selected under the members list, set its Visible property to False.
To view the report
- Click the preview tab to view the report at design time.
OR
- Open the report in the Viewer. See Windows Forms Viewer for further information.