Reports with XML Data
In This Topic
This topic explains the steps involved in connecting a page report to an XML data source and creating a dataset. It also demonstrates the use of the List control.
Note:
- This topic uses the Factbook sample database. The Factbook.xml file can be downloaded from GitHub: ..\Samples14\Data\Factbook.xml.
- Although this topic uses Page reports, you can also implement this using RDL reports.
When you complete these steps you get a layout that looks similar to the following at design time and at run time.
Design-Time Layout
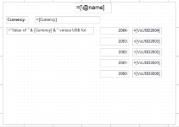
Report with XML Data at Design Time
Run-Time Layout
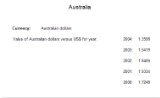
Report with XML Data at Run Time
Add an ActiveReport to the Visual Studio project
- Create a new Visual Studio project.
- In the New Project dialog that appears, select ActiveReports 14 Page Report Application and in the Name field, rename the file as ExchangeRates.
- Click OK to create a new ActiveReports 14 Page Report Application. By default a Page report is added to the project.
See Quick Start for information on adding different report layouts.
Connect the report to a data source
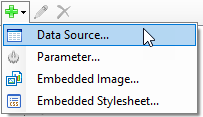
- In the Report Explorer, right-click the Data Sources node and select the Add Data Source option or select Data Source from the Add button.
- In the Report Data Source Dialog that appears, select the General page and in the Name field, enter a name like Factbook.
- Under the Type field, select XML Provider.
- In the Connection Properties tab, select the type of XML data as External file or URL.
- Click the dropdown in Select or type the file name or URL field.
- Select <Browse...> navigate to Factbook.xml. See Connect to a Data Source for information on connecting to a data source.
- Click the Connection String tab. The connection string that gets generated is
xmldoc=[User Folder]\Samples14\Data\Factbook.xml. You can validate the connection string by clicking the Validate DataSource icon .
. - Click OK.
Add a dataset
- In the Report Explorer, right-click the data source node and select the Add Data Set option or select Data Set from the Add button.
- In the DataSet Dialog that appears, select the General page and enter the name of the dataset as ExchangeRates.
- On the Query page of this dialog, click the Edit with XML Query Designer icon
 to open XML DataSet Query Builder dialog.
 - Choose the XPath upto Country from the tree nodes. The following XML query is generated:
countries/country - Click the Validate DataSet icon at the top right hand corner above the Query box to validate the query.
You can see all the fields available in the dataset on the Fields page. - Click OK to close the dialog. Your data set and queried fields appear as nodes to the data source in the Report Explorer.
Add controls to the report
- From the toolbox, drag a List data region onto the design surface of the report and go to the Properties window to set the DataSetName property to ExchangeRates.
- From the Report Explorer, drag the @name field onto the list, center it at the top, and go to the Properties window to set the FontSize property to 14pt.
- From the Report Explorer, drag the following fields onto the list with properties set as described in the table below.
Field Name Property Name Currency Location: 1.125in, 0.5in
Size: 2.25in, 0.25inVsUSD2004 Location: 4.5in, 0.875in
Size: 1in, 0.25inVsUSD2003 Location: 4.5in, 1.25in
Size: 1in, 0.25inVsUSD2002 Location: 4.5in, 1.625in
Size: 1in, 0.25inVsUSD2001 Location: 4.5in, 2in
Size: 1in, 0.25inVsUSD2000 Location: 4.5in, 2.375in
Size: 1in, 0.25inNote: You will notice that the expressions created for these fields are different than usual. Because Visual Basic syntax does not allow an identifier that begins with a number, any numeric field names must be treated as strings in expressions. - From the toolbox, drag a TextBox onto the list and go to the Properties window to set the properties as described in the table below to combine static text with a field value.
Property Name Property Value Location 0.145in, 0.875in Size 3in, 0.25in Value ="Value of " & Fields!Currency.Value & " versus US$ for year:" - From the toolbox, drag TextBox controls onto the list and go to the Properties window to set the properties as described in the table below to create static labels.
TextBox1
Property Name Property Value Location 0.125in, 0.5in Size 0.75in, 0.25in FontWeight Bold Value Currency: TextBox2
Property Name Property Value Location 3.375in, 0.875in Size 1in, 0.25in TextAlign Right Value 2004: TextBox3
Property Name Property Value Location 3.375in, 1.25in Size 1in, 0.25in TextAlign Right Value 2003: TextBox4
Property Name Property Value Location 3.375in, 1.625in Size 1in, 0.25in TextAlign Right Value 2002: TextBox5
Property Name Property Value Location 3.375in, 2in Size 1in, 0.25in TextAlign Right Value 2001: TextBox6
Property Name Property Value Location 3.375in, 2.375in Size 1in, 0.25in TextAlign Right Value 2000:
View the report
- Click the preview tab to view the report at design time.
OR
- Open the report in the Viewer. See Windows Forms Viewer for further information.
See Also