You can create a Page or an RDL report that hosts a subreport. This walkthrough illustrates how to create an RDL report using a subreport.
The walkthrough is split up into the following activities:
- Creating a report for the subreport
- Connecting the subreport to a data source
- Adding a dataset with a parameter to the subreport
- Adding a report parameter to the subreport
- Adding controls to display data on the subreport
- Creating the main report
- Connecting the main report to a data source
- Adding a dataset to the main report
- Adding controls to display data on the main report
- Viewing the report
When you complete this walkthrough you get a layout that looks similar to the following at design time and at run time.
Design-Time Layout
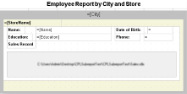
Subreport in RDL report at design time
Run-Time Layout
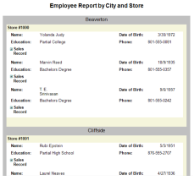
Subreport in RDL report at run time
To add a report for the subreport
- Create a new Visual Studio project.
- From the Project menu, select Add New Item.
- In the Add New Item dialog that appears, select ActiveReports 14 RDL Report and in the Name field, rename the file as Sales.rdlx.
- Click the Add button to open a new RDL report in the designer.
- In the Solution Explorer, select Sales.rdlx and set the Build Action property to Content and the Copy to Output Directory property to Copy Always.
See Quick Start for information on adding different report layouts.
To connect the subreport to a data source
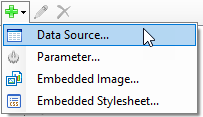
- In the Report Explorer, right-click the Data Sources node and select the Add Data Source option or select Data Source from the Add button.
- In the Report Data Source Dialog that appears, select the General page and in the Name field, enter a name like Reels.
- On this page, create a connection to the Reels database. See Connect to a Data Source for information on connecting to a data source.
To add a report parameter to the subreport
- In the Report Explorer, right-click the Parameters node and select the Add Parameter option or select Parameter from the Add button.
- Under Name, enter EmployeeID.
- Under Data type, select Integer.
- Click OK to close the dialog.
To add a dataset with a parameter to the subreport
When you add a query parameter using the syntax required by your database you must add a parameter to the Parameters page to ensure that the parameter value is passed to the query from the Report Parameters collection.
- In the Report Explorer, right-click the data source node and select the Add Data Set option or select Data Set from the Add button.
- In the DataSet Dialog that appears, select the General page and enter the name of the dataset as EmployeeSales. This name appears as a child node to the data source icon in the Report Explorer.
- On the Parameters page under Parameter Name enter EmployeeID.
- Under Value enter =Parameters!EmployeeID.Value
- On the Query page of this dialog, in the Query field enter the following SQL query.
SQL Query Copy CodeSELECT * FROM EmployeeSales
- Click the Validate DataSet icon at the top right hand corner above the Query box to validate the query.

- Click OK to close the dialog. Your data set and queried fields appear as nodes in the Report Explorer.
To add controls to display data on the subreport
- From the toolbox, drag a Table data region onto the body of the report and go to the properties window to set the DataSetName property to EmployeeSales.
- Click inside the table to display the column and row handles along the top and left sides of the table.
- Right-click the handle above the rightmost column and select Insert Column to the Right to add another column.
- Click the column handle at the top of each column in turn to select it, and in the property grid, set the Width property as indicated in the table.
Column Width First 1.5in Second 1.5in Third 1.2in Fourth 1.55in Tip: In most cases it is easier to resize existing columns before adding new columns because this prevents the table from growing horizontally and pushing the report width beyond what will fit on paper. - Right-click the handle to the left of the table detail row and select Insert Group to open the Table-Groups dialog.
- Under Expression select =Fields!EmployeeID.Value. This groups all details from each employee.
- Change the Name to Employee and click OK to close the dialog. A grouping row is added to the table.
Note: You cannot change the name of a table group until after you have set the expression.
- Right-click the handle to the left of the table detail row and select Edit Group to access the Table-Detail Grouping dialog.
- Under Expression select =Fields!SaleID.Value and click OK to close the dialog. This lists the total amount of each sale instead of listing each item sold within each SaleID.
- Right-click the handle to the left of the grouping row and select Insert Row Below. We will use this new row for static labels that repeat at the top of each new group.
- Right-click any handle to the left of the table and select Table Header to toggle off the table header.
- Right-click any handle to the left of the table and select Table Footer to toggle off the table footer.
- In the Report Explorer, select the Body node and go to the Properties window to set the Size property to 5.75in, 1in so that it fits inside the subreport control on the main report.
To add data fields to the Table data region
- In the Report Explorer, from the EmployeeSales dataset, drag the following field onto the first group header row of the table.
Data Field Column Name Property Name Name TableColumn1 FontWeight: Bold - Use the Shift key and the mouse to select the first two cells in the first group header row, right-click and select Merge Cells. This allows the employee name to span two columns in the table.
- Using the handle to the left of the first group header row, select the row and set the BackgroundColor property to LightSteelBlue.
Tip: Even if you do not want to use colors in your finished report, it is often helpful to do so during the design of a report to make identification of the various sections easier for troubleshooting when you preview it. - Enter the following text into the cells in the second group header row of the table.
Data Field Column Name Property Name Sale Date TableColumn1 FontWeight: Bold
TextAlign: RightSale Number TableColumn2 FontWeight: Bold
TextAlign: RightQuantity TableColumn3 FontWeight: Bold
TextAlign: RightTotal TableColumn4 FontWeight: Bold
TextAlign: Right - Using the handle to the left of the second group header row, select the row and set the BackgroundColor property to LightGray.
- In the Report Explorer, drag the following fields from the EmployeeSales dataset onto the detail row of the table.
Data Field Column Name Property Name Sale Date TableColumn1 Format: Short date SaleID TableColumn2 Quantity TableColumn3 Total TableColumn4 Format: Currency - In the detail row of the table, select the textbox with the Quantity data field and go to the Properties window to change the Value property to =Sum(Fields!Quantity.Value). This adds the Sum aggregate to the expression for the field and shows a summary of the quantity field for each SalesID.
- In the detail row of the table, select the textbox with the Total data field and go to the Properties window to change the Value property to =Sum(Fields!Total.Value). This adds the Sum aggregate to the expression for the field and shows a summary of the total field for each SalesID.
- In the Report Explorer, from the EmployeeSales dataset, drag the following fields onto the group footer row of the table. Notice that the value of fields dragged onto the group footer row automatically use the Sum aggregate function.
Data Field Column Name Property Name Quantity TableColumn3 Value: =Sum(Fields!Quantity.Value) Total TableColumn4 Format: Currency
Value: =Sum(Fields!Total.Value) - Enter the following text into the indicated cell in the group footer row of the table.
Text Column Name Property Name Employee Total: TableColumn2 FontWeight: Bold
TextAlign: Right - Using the handle to the left of the group footer row, select the row and in the BackgroundColor property select LightGray.
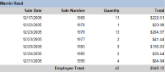
- Go to the preview tab, enter 1035 for the Employee ID, and click the View Report button. You get a layout that looks similar to the following at design time and at run time.
Design-Time Layout Run-Time Layout 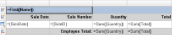
Report Layout at Design Time
Report Layout at Run Time
- From the File menu, select Save and save this file. This report functions as the subreport you use in the main report.
To create the main report
- From the Visual Studio Project menu, select Add New Item.
- In the Add New Item dialog that appears, select ActiveReports 14 RDL Report and in the Name field, rename the file as Employees.rdlx.
- Click the Add button to open a new fixed RDL report in the designer.
- In the Report Explorer, select the Body node and go to the Properties window to set the Size property to 6.5in, 3.6in.
To connect the main report to a data source
- In the Report Explorer, right-click the Data Sources node and select the Add Data Source option or select Data Source from the Add button.
- In the Report Data Source Dialog that appears, select the General page and in the Name field, enter a name like Reels.
- On this page, create a connection to the Reels database. See Connect to a Data Source for information on connecting to a data source.
To add a dataset to the main report
- In the Report Explorer, right-click the data source node and select the Add Data Set option or select Data Set from the Add button.
- In the DataSet Dialog that appears, select the General page and enter the name of the dataset as EmployeeInfo. This name appears as a child node to the data source icon in the Report Explorer.
- On the Query page of this dialog, in the Query field enter the following SQL query.
SQL Query Copy CodeSELECT * FROM EmployeeInfo
- Click the Validate icon to validate the query and to populate the Fields list.
- Click OK to close the dialog. Your data set and queried fields appear as nodes in the Report Explorer.
To add controls to display data on the main report
The following steps demonstrate how you can add controls and create the main report:
To add a static label to the top of the main report
From the toolbox, drag a TextBox control onto the body of the report and set the following properties:
| Property Name | Property Value |
|---|---|
| Font | Normal, Arial, 14pt, Bold |
| Location | 0in, 0in |
| Size | 6.5in, 0.3in |
| TextAlign | Center |
| Value | Employee Report by City and Store |
To add a List data region that repeats data for each city
- Drag a List data region from the toolbox onto the body of the report and with the data region selected, go to the Properties Window to set the following properties:
Property Name Property Value BackgroundColor Silver DataSetName EmployeeInfo Location 0in, 0.5in
Size 6.5in, 3.1in - At the bottom of the Properties Window, select the Property dialog command. See Properties Window for further details on accessing commands.
- In the List dialog that appears, select Detail Grouping.
- Under Expression, select =Fields!City.Value
- Click OK to close the dialog.
- From the Report Explorer, drag the City field onto the List data region and set the following properties:
Property Name Property Value FontSize 12pt Location 0in, 0in Size 6.5in, 0.25in TextAlign Center
To nest a second List data region that repeats data for each store within the city
- Drag a List data region from the toolbox onto the the first list and with the data region selected, go to the Properties Window to set the following properties:
Property Name Property Value BackgroundColor Beige DataSetName EmployeeInfo Location 0.125in, 0.3in Size 6.25in, 2.7in - At the bottom of the Properties Window, select the Property dialog command. See Properties Window for further details on accessing commands.
- In the List dialog that appears, select Detail Grouping.
- Under Expression, select =Fields!StoreName.Value
- Click OK to close the dialog.
- From the Report Explorer, drag the StoreName field onto the list and set the following properties:
Property Name Property Value FontWeight Bold Location 0in, 0in Size 2in, 0.25in
To nest a third List data region that repeats data for each employee in the store
- Drag a List data region from the toolbox onto the second list and with the data region selected, go to the Properties Window to set the following properties:
Property Name Property Value BackgroundColor White DataSetName EmployeeInfo Location 0in, 0.25in Size 6.125in, 2.125in - At the bottom of the Properties Window, select the Property dialog command. See Properties Window for further details on accessing commands.
- In the List dialog, select Detail Grouping.
- Under Expression, select =Fields!EmployeeID.Value
- Click OK to close the dialog.
- From the Report Explorer, drag the following fields onto the list and set the following properties:
Data Field Property Name Name Location: 1.125in, 0in
Size: 2.625in, 0.25inEducation Location: 1.125in, 0.25in
Size: 2.625in, 0.25inDateOfBirth Location: 5in, 0in
Size: 0.875in, 0.25in
Format: Short datePhoneNumber Location: 4.875in, 0.25in
Size: 1in, 0.25in - From the toolbox, drag five text boxes onto the List and set the following properties:
TextBox Name Value Property Property Name TextBox 1 Name: Location: 0.125in, 0in
Size: 0.625in, 0.25in
FontWeight: BoldTextBox 2 Education: Location: 0.125in, 0.25in
Size: 0.875in, 0.25in
FontWeight: BoldTextBox 3 Date of Birth: Location: 3.875in, 0in
Size: 1in, 0.25in
FontWeight: BoldTextBox 4 Phone: Location: 3.875in, 0.25in
Size: 0.875in, 0.25in
FontWeight: BoldTextBox 5 Sales Record Location: 0.125in, 0.5in
Size: 1in, 0.25in
FontWeight: Bold
To add a Subreport control to the main report
- From the toolbox, drag a Subreport control onto the third list and with the control selected, go to the Properties Window to set the following properties:
Property Name Property Value Location 0.125in, 0.75in NoRows No sales recorded for this employee during 2005. ReportName Sales (ensure that this report is saved in the same directory as the Sales report)
Note: To view the report in the preview tab, you should specify the full path to the subreport.Size 5.75in, 1.3in Visibility: Hidden True (hides the subreport initially) Visibility: ToggleItem Sales Record text box added in the previous procedure (puts a toggle image next to the text that shows the subreport when clicked) - At the bottom of the Properties Window, select the Property dialog command. See Properties Window for further details on accessing commands.
- On the Parameters page of the Subreport dialog, set the Parameter Name to EmployeeID. This name must match the parameter in the subreport exactly.
- Set the Parameter Value to =Fields!EmployeeID.Value.
Note: You can use the option of having the subreport automatically apply the same theme as the hosting report. This option is available on the General page of the Subreport Properties.
- Click OK to close the dialog.
To view the report
- Click the preview tab to view the report.
OR
- See Windows Forms Viewer to display report in the Viewer at run time.