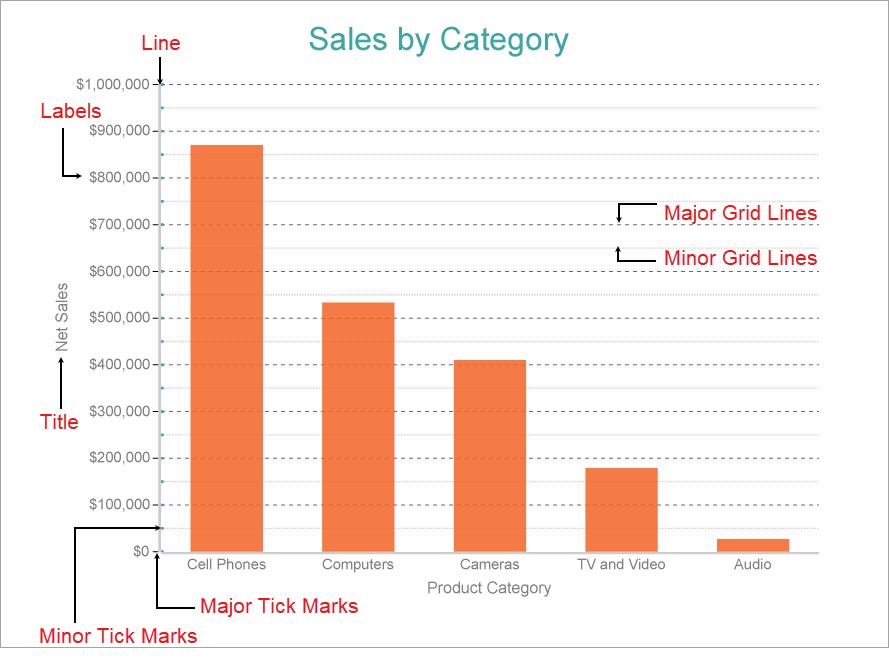
Being an essential part of most chart types, the Axis can perform the following functions:
Height: Represents the height of the Axis in percentage relative to the overall chart height. This property is applicable to the horizontal axis.
MaxHeight: Represents the maximum height of the Axis in percentage relative to the overall chart height. This property applies to the horizontal axis and its default value is 100%.
MaxWidth: Represents the maximum width of the Axis in percentage relative to the overall chart width. This property applies to the vertical axis and its default value is 100%.
Width: Represents width of the Axis in percentage relative to the overall chart width. This property applies to the vertical axis.
See the section Set Position of Axis to know about customizing the position of Y-axis.
AxisType: Designates the type of Axis, whether be it X or Y.
Plots: Designates the plot in which the X or Y axis exists.
Format: Represents the formatting string used for rendering dates and numbers.
LabelField: Represents customized labels for the X-axis. See the section Set Custom Labels for X-Axis to know about displaying the custom labels for category fields .
LabelsAngle: Represents the rotation angle of axis labels in degrees.
RowsCount: Specifies the number of rows for the X-axis label.
LabelsStyle: Represents the style of the axis labels
ShowLabels: Indicate whether to show or hide axis labels.
Origin: Represents the value or ordinal number at which both the axes cross each other.
Overlapping: Indicates whether the labels can be overlapped.
Position: Indicates the axis position.
Reversed: Indicates whether the axis is reversed from top to bottom, or left to right.
LineStyle: Select the style of the line.
ShowLine: Indicates whether or not to show the line.
MajorGridInterval: Number of units between the major axis ticks.
MajorGridStyle: Style of the major gridline.
MajorTickMark: Location of the major grid tick marks.
MajorTickSize: Length of the major grid tick marks.
MajorTickStyle: Style of the major grid ticks.
ShowMajorGrid: Indicates whether or not to show the major gridlines.
MinorGridInterval: Number of units between minor axis ticks.
MinorGridStyle: Style of the minor grid line.
MinorTickMark: Location of the minor grid line tick marks.
MinorTickSize: Length of the minor gridline tick marks.
MinorTickStyle: Style of the minor grid ticks.
ShowMinorGrid: Indicates whether or not to show the minor gridlines.
LogarithmicBase: Represents the axis logarithmic base for logarithmic scale.
Max: Shows the maximum axis value.
Min: Shows the minimum axis value.
Scale: Represents the scale of the axis.
Title: Represents the title of the axis.
TitleStyle: Represents the styling of the Axis Title.
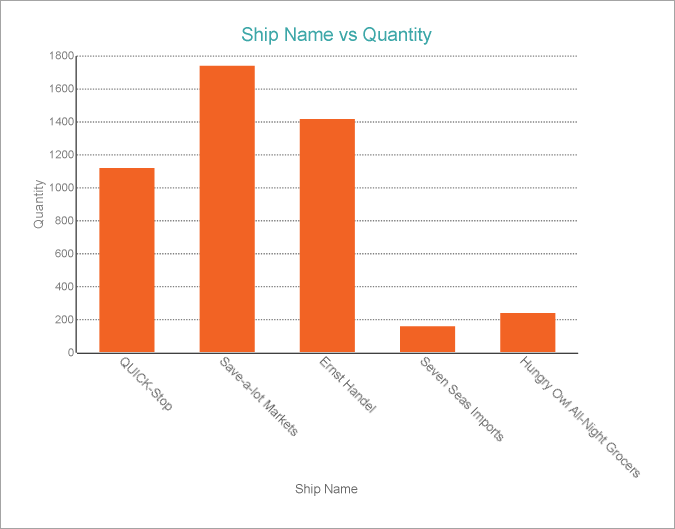
Using LabelField property, you can display a custom label for the X-axis, that is, the Category Field. For example, in the following chart, the default labels for X-Axis show Ship Names since the Category Field is bound to [ShipName].
The chart binds to the 'Invoices' table of the Nwind.db. See Custom Data Provider for more information.
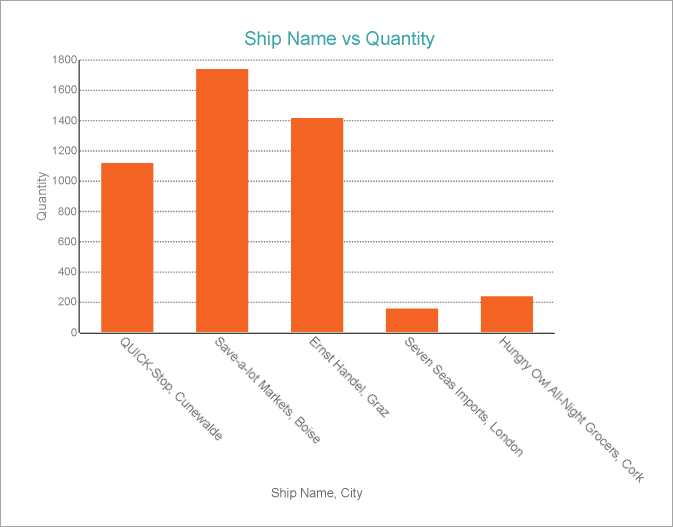
You can customize the X-Axis labels of the chart as follows.
The below image shows how the X-Axis labels show customized labels.
A set of four properties for the X and Y axes - Width, MaxWidth, Height, and MaxHeight help users to control the position of the axes by specifying the height and width values for the X and Y axes, and their corresponding maximum values up to which the axes can grow. If the length of the data labels and titles in a chart exceeds the specified maximum height and width, labels are clipped-off. These properties are used to align a chart with the other controls or data regions.
Note that when a user does not specify these properties, the height and width for the chart axes are calculated automatically depending on the bound data. If the user wants to set the exact Y-axis position, the 'Width' and 'MaxWidth' properties should be set to one value. This value should be found by the user at design time.
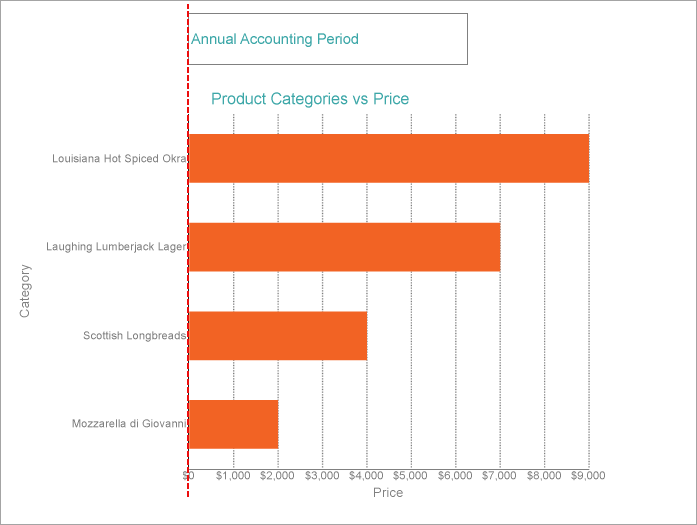
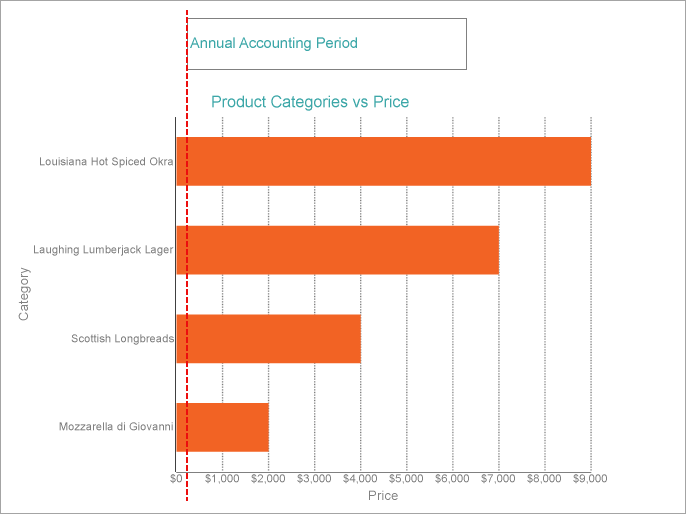
Let us see how to align the vertical axis of a Chart data region relative to a Textbox control on the same page. The below image shows how the chart appears with the following properties set for the vertical axis.
The steps to set the Y-Axis position of the chart are as follows.
The below image shows how the vertical axis of the chart is aligned with the textbox after the 'Width' property is set to a suitable value observed at the design time: