In This Topic
A Chart data region helps you to visualize your data graphically. It is a data visualization control primarily based on slicing data through encodings.
This article provides information about all the chart elements. Further subtopics provide details on every other aspect of charts that will help you design any chart supported by ActiveReports..
Chart Elements
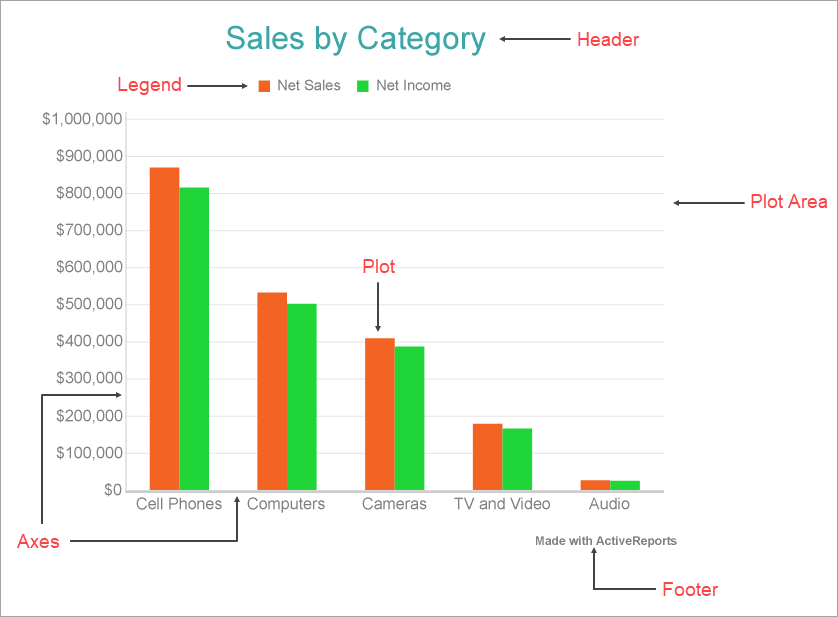
The below image illustrates the elements that make up the Chart data region. These elements help you analyze the visual information and interpret numerical and relational data in a chart.
You can view all the chart elements in the Report Explorer and access properties through the Chart Smart Panels and Properties window. For more information on chart elements, see the below sections.
- Plot Area
- The plot area is the area of the chart where the data is plotted graphically. It also includes the chart axes and legend.
- Plot
- The plot is where the actual chart encodings are configured and converted to visual attributes, that is, graphs. It also includes other configuration settings such as applying Rules, adding Trendlines, setting clipping mode, offset, etc. For more information, see the Plots topic.
- Axes
- Typically, a chart consists of two axes that are used to plot the data - vertical axis (also known as Y-axis) and horizontal axis (also known as X-axis). You can change the axis type, hide the axis label or title, customize the line appearance, etc. For more information, see the Axes topic.
- Legend
- The legend serves as a key to the specific colors or patterns being used to show series values in the chart. To display legends for each plot on a chart, use VALUESNAME as the color field encoding. For more information, see the Legends topic.
- Header
- The chart header is used to display a title for the chart. The chart header appears above the plot area. Use the header settings to control the text formatting, padding, background color, alignment, etc. for a chart header.
- Footer
- The chart footer is used to add a footer for the chart. The chart footer is displayed below the plot area. Use the footer settings to control the text formatting, padding, background color, alignment, etc. for a chart footer.
Supported Chart Types
Following is the list of supported chart types in Page/RDLX reports. Each of these are discussed under Plots topic.