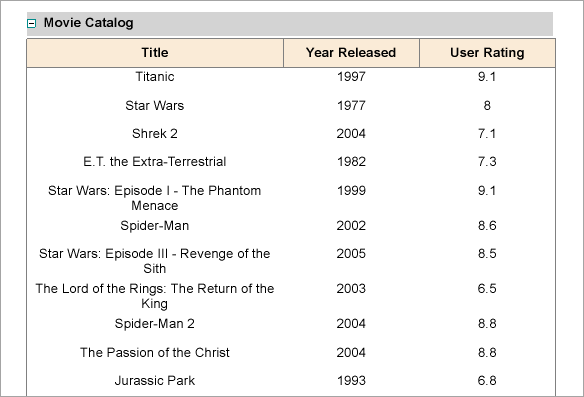
With the drill-down feature, you can temporarily hide a part of your report. That hidden part can be controls, groups, columns or rows. When you open a drill-down report, part of the data is hidden so that you can only see high-level data until you request for more detail. In such reports you find an expand icon (plus-sign image) next to the toggle item in the report. Clicking the toggle image, or plus sign, expands hidden content into view and the expand icon changes to a collapse icon (minus-sign). When you click the minus-sign image, it hides the content and returns the report to its previous state.
To create a drill-down report, use the Visibility properties of controls, groups, columns, or rows. Simply set the Visibility-hidden property to True and set the toggle item to the name of another item in the report, usually a text box in the group containing the hidden item. At run time, this puts a plus sign next to the toggle item which the user can click to display the hidden data.
If you export a drill-down report, any content which is hidden at the time of export remains hidden in the exported file. If you want all of the content to appear in the exported file, you must first expand all hidden data.
In a Page report, you can set up data regions, report controls, table rows, and tablix row and column groups to collapse, so that users can drill down into the data they choose to view.
In order to collapse an item, you use the Visibility settings available in the Properties Panel or in the control dialog. You set the initial visibility of the report controls to Hidden and allow the user to toggle them by clicking other report controls (usually a TextBox).
When the report is initially displayed at run-time, the toggle items display with plus sign icons that you can click to display the detail data. Follow these steps to set a drill-down link.