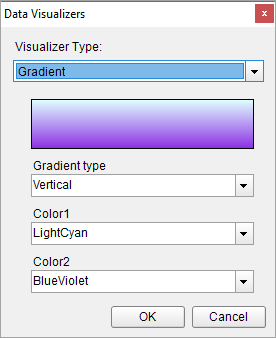
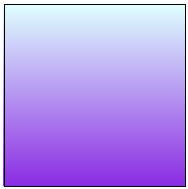
The Gradient data visualization displays a gradient of color that transitions from one color to another.
When you select a Shape control on your report, in the Properties window, drop down the BackGroundImage - Value property and select <Data Visualizer...> to launch the dialog. The same is true if you select an Image control and drop down the Value property. To build the data visualizer expression, select the appropriate values for each of the options in the dialog.
=Gradient(Gradient type, Color1, Color2)
Using Data Visualizers, the gradient can be applied in TextBox, Shape, CheckBox, and Container controls from BackgroundImage - Value property and in Image control from Value property. The following example shows how Gradient background style can be simply applied to a control.
Example
Set the following expression in the BackgroundImage.Value property of the Shape .
| Paste into the BackgroundImage Value property of a Shape |
Copy Code
|
|---|---|
=Gradient("Vertical","LightCyan","BlueVoilet") |
|