Fibonacci tool enables the calculation and plotting of various alert levels that are useful in financial charts. This topic explains how to initialize a Fibonacci tool in a FinancialChart, and use it for performing stock analysis.
To display uptrend or downtrend using Fibonacci series, set the value of Uptrend property to true (default) or false. The Uptrend value, when set to true, plots uptrending values, and setting it to false indicates and plots the downtrending value. Set the position of the label by setting the LabelPosition property to:
The image below shows how FinancialChart appears when the Fibonacci series is added to the chart, and Uptrend value is set to true with LabelPosition set to Left. The image shows Fibonacci Retracements.
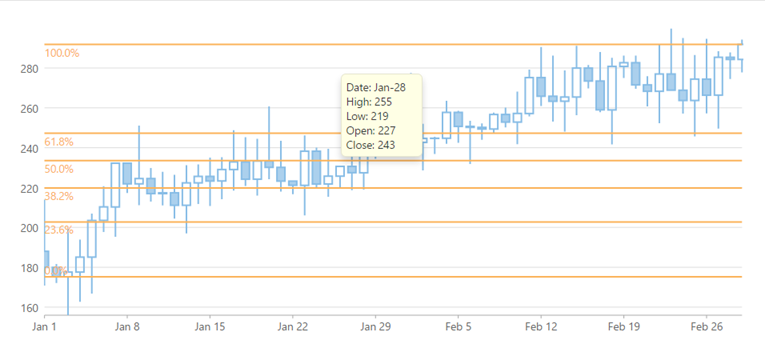
The following code example demonstrates how to add Fibonacci series and tooltip content to the FinancialChart. This example uses the sample created in the Quick Start section.
| HTML |
Copy Code
|
|---|---|
@using C1.Web.Mvc.Chart; @model List<FinanceData> <script type="text/javascript"> var tooltipContent = function (ht) { var item = ht.series.collectionView.items[ht.pointIndex]; if (item) { return 'Date: ' + wijmo.Globalize.format(ht.x, 'MMM-dd') + '<br/>' + 'High: ' + item.High.toFixed() + '<br/>' + 'Low: ' + item.Low.toFixed() + '<br/>' + 'Open: ' + item.Open.toFixed() + '<br/>' + 'Close: ' + item.Close.toFixed() + '<br/>' } }; </script> <c1-financial-chart binding-x="X" chart-type="C1.Web.Mvc.Finance.ChartType.Candlestick"> <c1-items-source source-collection="Model"></c1-items-source> <c1-financial-chart-series binding="High,Low,Open,Close"></c1-financial-chart-series> <c1-flex-chart-fibonacci binding="Close" uptrend="true" label-position="LabelPosition.Left"></c1-flex-chart-fibonacci> <c1-flex-chart-tooltip content="tooltipContent"></c1-flex-chart-tooltip> </c1-financial-chart> |
|
Financial charts in MVC Edition support Fibonacci Fan lines, which are trend lines that are based on Fibonacci retracement points. The rising Fibonacci Fan lines can be used to predict support levels or reversal zones, while falling fan lines can help predict resistance levels or reversal zones.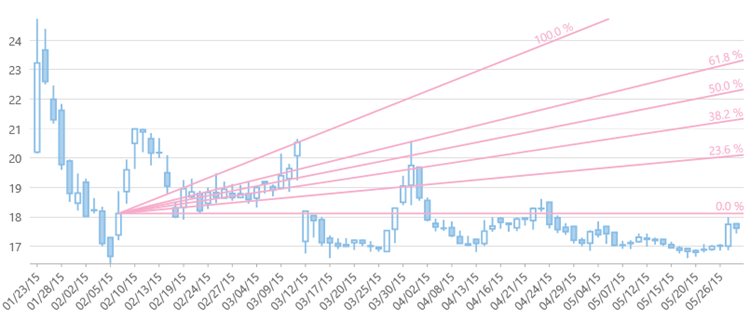
| HTML |
Copy Code
|
|---|---|
<c1-financial-chart binding-x="X" chart-type="C1.Web.Mvc.Finance.ChartType.Candlestick"> <c1-items-source source-collection="Model"></c1-items-source> <c1-financial-chart-series binding="High,Low,Open,Close" name="BOX"></c1-financial-chart-series c1-flex-chart-fibonacci-fans binding="Close" start="new DataPoint(10, 18.12)" end="new DataPoint(32, 20.53)" label-position="LabelPosition.Top"></c1-flex-chart-fibonacci-fans> /c1-financial-chart> |
|
These are the half circles extending out from a trend line. Fibonacci arcs help predict reversal zones or resistance for counter trend bounce situations after decline.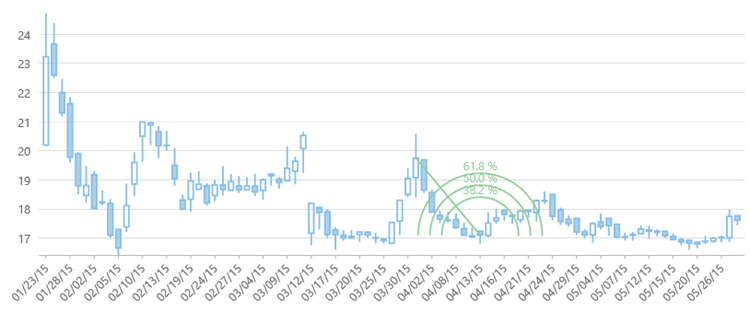
| HTML |
Copy Code
|
|---|---|
<c1-financial-chart binding-x="X" chart-type="C1.Web.Mvc.Finance.ChartType.Candlestick"> <c1-items-source source-collection="Model"></c1-items-source> <c1-financial-chart-series binding="High,Low,Open,Close" name="BOX"></c1-financial-chart-series> <c1-flex-chart-fibonacci-arcs binding="Close" start="new DataPoint(46, 19.75)" end="new DataPoint(54, 17.10)" label-position="LabelPosition.Left"></c1-flex-chart-fibonacci-arcs> </c1-financial-chart> |
|
Fibonacci Time Zones are based on Fibonacci sequence and represented as vertical lines, which are used to predict reversal points in future. MVC Edition supports Fibonacci Time Zones for Financial Charts.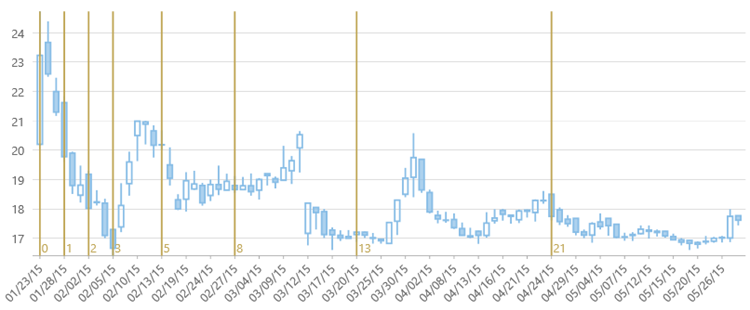
| HTML |
Copy Code
|
|---|---|
<c1-financial-chart binding-x="X" chart-type="C1.Web.Mvc.Finance.ChartType.Candlestick"> <c1-items-source source-collection="Model"></c1-items-source> <c1-financial-chart-series binding="High,Low,Open,Close" name="BOX"></c1-financial-chart-series> <c1-flex-chart-fibonacci-time-zones binding="Close" start-x="0" end-x="3"></c1-flex-chart-fibonacci-time-zones> </c1-financial-chart> |
|