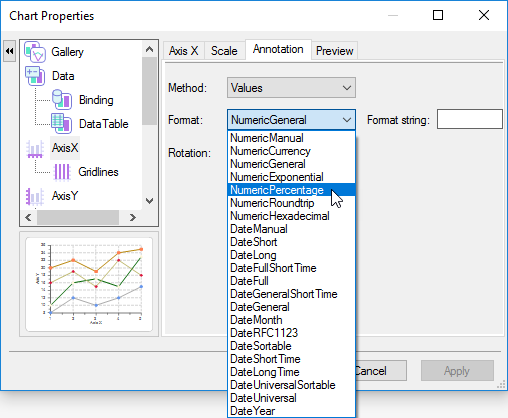
The Annotation tab allows you to specify whether you would like the AxisX, AxisY, or AxisY2 to be labeled as Values or ValueLabels. If you select Values from the Method drop-down box a Format drop-down box will appear. Here you can select from various types of formats. Also, you can specify the format string in the Format string textbox. For more information see the Values Annotation. For more information about the Format types, see FormatEnum Enumeration.
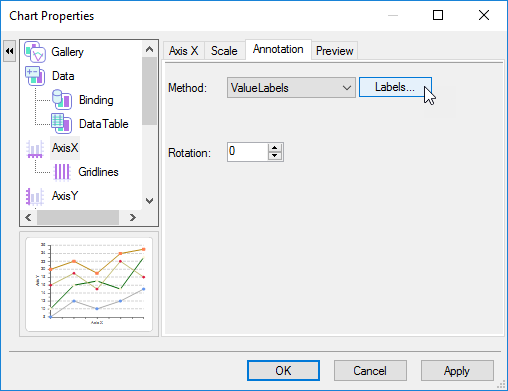
If you select ValueLabels from the Method drop-down box, a Labels button appears. Clicking on the Labels button exposes the ValueLabel Collection Editor dialog box. Here you can add members to your labels. For more information about the ValueLabel Collection Editor see the ValueLabel Collection Editor.