FlexChart | ComponentOne
Elements / Legend
In This Topic
    Legend
    In This Topic

    Legend is a chart element which displays a list of colors, symbols and text corresponding to each data series drawn on that chart. It helps in understanding and analysis of the plotted data in the case of multiple series.

    In FlexChart, a legend is automatically displayed if the Name property of the series is set. In other words, the Name property of series is required to generate a legend entry corresponding to the same. Also, FlexChart automatically places the legend according to the space available on the chart area. However, you can also set it to display in top, bottom, left or right with respect to the plot area by setting the Position property. To use the available space in the most optimized manner, FlexChart displays the legend horizontally when placed in top or bottom and vertically when placed in left or right of the plot area. At the same time, FlexChart also allows you to set the Orientation as per requirement.

    Legend

    flexChart1.Series.Clear();
    
    //Setting type of chart to Line
    flexChart1.ChartType = ChartType.Line;
    
    //Setting FlexChart's Header 
    flexChart1.Header.Content = "Daily Price Movement";
    
    //Binding FlexChart's AxisX to 'Name' so country names appear in Horizontal axis
    flexChart1.BindingX = "Date";
    
    //Creating and adding multiple series, one for High and one for Low
    this.flexChart1.Series.Add(new Series { Binding = "High", Name = "Highs" });
    this.flexChart1.Series.Add(new Series { Binding = "Low", Name = "Lows" });
                
    //Passing data in FlexChart
    flexChart1.DataSource = GetQuotes(100);
    
    //Setting legends Position and Orientation
    flexChart1.Legend.Position = Position.Top;
    flexChart1.Legend.Orientation = C1.Chart.Orientation.Horizontal;
    
    flexChart1.Series.Clear()
    
    'Setting type of chart to Line
    flexChart1.ChartType = ChartType.Line
    
    'Setting FlexChart's Header 
    flexChart1.Header.Content = "Daily Price Movement"
    
    'Binding FlexChart's AxisX to 'Name' so country names appear in Horizontal axis
    flexChart1.BindingX = "Date"
    
    'Creating and adding multiple series, one for High and one for Low
    Me.flexChart1.Series.Add(New Series() With {
         .Binding = "High",
         .Name = "Highs"
    })
    Me.flexChart1.Series.Add(New Series() With {
         .Binding = "Low",
         .Name = "Lows"
    })
    
    'Passing data in FlexChart
    flexChart1.DataSource = GetQuotes(100)
    
    'Setting legends Position and Orientation
    flexChart1.Legend.Position = Position.Top
    flexChart1.Legend.Orientation = C1.Chart.Orientation.Horizontal
    

    Toggle Series

    With FlexChart, user can even toggle the visibility of a data series by clicking on corresponding legend entry at run-time, if the LegendToggle property of FlexChart class is set to True.

    //Allow end user to toggle the visibility of series by clicking the legend
    flexChart1.LegendToggle = true;
    
    'Allow end user to toggle the visibility of series by clicking the legend
    flexChart1.LegendToggle = True
    

    Manage Long Legend Text

    There are times when there is not enough space to display the complete text of legend entries in the chart area. FlexChart provides the TextWrapping property of Legend class that allows you to wrap or trim the text when width of text exceeds the value specified in the ItemMaxWidth property. The TextWrapping property accepts values from TextWrapping enumeration.

    TextWrapping = TextWrapping.Wrap

    TextWrapping = TextWrapping.Truncate

    Legend wrap Legend truncate
    //Wrap the legend if text width exceeds the maximum limit
    flexChart1.Legend.ItemMaxWidth = 70;
    flexChart1.Legend.TextWrapping = TextWrapping.Wrap;
    
    'Wrap the legend if text width exceeds the maximum limit
    flexChart1.Legend.ItemMaxWidth = 70
    flexChart1.Legend.TextWrapping = TextWrapping.Wrap
    

    Style Legend

    FlexChart also allows you to style the legend and legend entries using the Style property of Legend class. This property lets you specify the fill, fill color, stroke width, stroke color etc. of the legend.

    style legend

    //Styling Legends
    flexChart1.Legend.Style.Font = new Font("Arial", 10, FontStyle.Italic);
    flexChart1.Legend.Style.StrokeWidth = 0.75f;
    flexChart1.Legend.Style.StrokeColor = Color.Firebrick;
    
    'Styling Legends
    flexChart1.Legend.Style.Font = New Font("Arial", 10, FontStyle.Italic)
    flexChart1.Legend.Style.StrokeWidth = 0.75F
    flexChart1.Legend.Style.StrokeColor = Color.Firebrick
    

    Legend Grouping

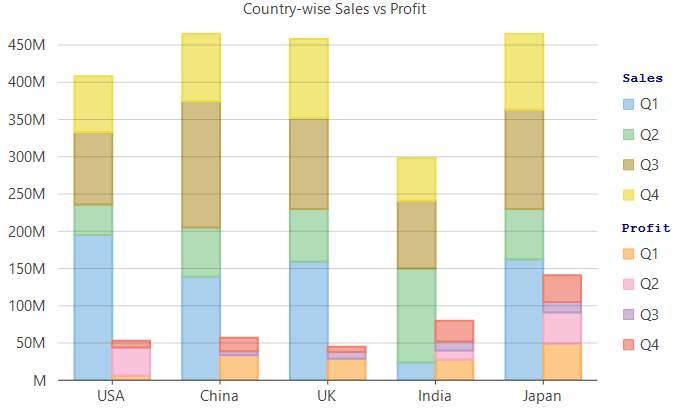
    Legend grouping refers to  categorization of legend entries according to the data presented by them. This feature is usually helpful in identifying the categories of data series in the case of multiple stacked series. For instance, while plotting sales and profit of multiple quarters in the same chart area, legend groups prove helpful in identifying which series are the sales series and which ones are the profit series.

    Legend grouping

    To create legend groups using FlexChart, the control provides the LegendGroup property which accepts a string value and groups the series with same value together. Value of this property not only acts as the group name but the group title as well which gets displayed on the top of the corresponding legend group. The series for which the LegendGroup property is not specified is treated as a part of 0th group and is displayed without any group title. FlexChart also lets you customize the legend group titles by using the GroupHeaderStyle property of Legend class.   

    //Specify group for each series
    flexChart1.Series[0].LegendGroup = "Sales";
    flexChart1.Series[1].LegendGroup = "Profit";
    flexChart1.Series[2].LegendGroup = "Sales";
    flexChart1.Series[3].LegendGroup = "Profit";
    flexChart1.Series[4].LegendGroup = "Sales";
    flexChart1.Series[5].LegendGroup = "Profit";
    flexChart1.Series[6].LegendGroup = "Sales";
    flexChart1.Series[7].LegendGroup = "Profit";
    
    // stylise legend group header
    flexChart1.Legend.GroupHeaderStyle.Stroke = Brushes.DarkBlue;
    flexChart1.Legend.GroupHeaderStyle.Font = new Font(FontFamily.GenericMonospace, 10f, FontStyle.Bold);
    
    'Specify group for each series
    flexChart1.Series(0).LegendGroup = "Sales"
    flexChart1.Series(1).LegendGroup = "Profit"
    flexChart1.Series(2).LegendGroup = "Sales"
    flexChart1.Series(3).LegendGroup = "Profit"
    flexChart1.Series(4).LegendGroup = "Sales"
    flexChart1.Series(5).LegendGroup = "Profit"
    flexChart1.Series(6).LegendGroup = "Sales"
    flexChart1.Series(7).LegendGroup = "Profit"
    
    ' stylise legend group header
    flexChart1.Legend.GroupHeaderStyle.Stroke = Brushes.DarkBlue
    flexChart1.Legend.GroupHeaderStyle.Font = New Font(FontFamily.GenericMonospace, 10F, FontStyle.Bold)
    
    See Also

    Documentation