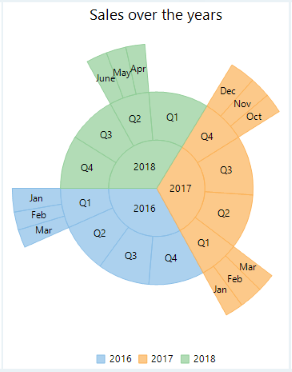
Sunburst, also known as a multi-level pie chart, is ideal for visualizing multi-level hierarchical data depicted by concentric circles. The circle in the center represents the root node surrounded by the rings representing different levels of hierarchy. Rings are divided based on their relationship with the parent slice with each of them either divided equally or proportional to a value. For instance, you can use sunburst to display sales over past few years or to display makes or models of a product.
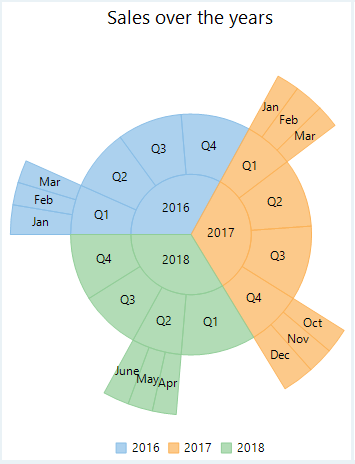
FlexChart for WinForms provides sunburst chart through a stand alone Sunburst control which is represented by the Sunburst class. The control appears as a pie chart when dropped on the form until it is provided with a hierarchical data using the DataSource property provided by the FlexPie class. This class also provides Binding and BindingName properties for setting numeric values and labels of the sunburst slices. You can also specify the angle from where you want to start drawing the slices in the clock wise direction by setting the StartAngle property. FlexChart also provides properties to create following variations of sunburst chart:
|
Doughnut Sunburst Chart |
Exploded Sunburst Chart |
Reversed Sunburst Chart |
|---|---|---|
 |
 |
 |
To create a sunburst chart using FlexChart:
At design-time
Using code
To create a WinForms sunburst chart through code, the first step after initializing the control is to clear the default series. Set up the data source through the DataSource property and configure the chart by setting the Binding and BindingName property. Also, set the ChildItemsPath property to generate child items in hierarchical data.
Note that the above sample code uses a custom method named GetSunburstData to supply data to the chart. You can set up the data source as per your requirements.