This is the most sophisticated example. Instead of showing a field's value as text, you can change its dimensions to create a chart.
To create a chart, the first thing you need to do is find out the scale, that is, the measurements that will be used to the maximum and minimum values. The "Sales Chart" report has a field designed to do this. It is a report footer field called SaleAmountMaxFld that has the size of the longest bar you want to appear on the chart, and holds the following expression:
=Max([SaleAmount])
Using Code:
To set the maximum value for the chart, set the SaleAmountMaxFld.Text property. Enter the following code:
To write code in Visual Basic
| Visual Basic |
Copy Code
|
|---|---|
SaleAmountMaxFld.Text = "Max([SaleAmount])" |
|
To write code in C#
| C# |
Copy Code
|
|---|---|
SaleAmountMaxFld.Text = "Max([SaleAmount])"; |
|
Using C1ReportDesigner:
To set the maximum value for the chart, set the SaleAmountMaxFld.Text property by completing the following steps:
=Max([SaleAmount])To draw the actual bars, the report has a detail field called BarFld that is formatted to look like a solid box. The Detail section has the following script assigned to its OnPrint property: BarFld.Width = SaleAmountMaxFld.Width * (SaleAmountFld / SaleAmountMaxFld)
This expression calculates the width of the bar based on the width and value of the reference field and on the value of the SaleAmountFld for the current record.
Using Code:
To draw the actual bars for the chart, set the OnPrint property. Enter the following code:
To write code in Visual Basic
| Visual Basic |
Copy Code
|
|---|---|
c1r.Sections.Detail.OnPrint = & _ "BarFld.Width = SaleAmountMaxFld.Width * " & _ "(SaleAmountFld / SaleAmountMaxFld)" |
|
To write code in C#
| C# |
Copy Code
|
|---|---|
c1r.Sections.Detail.OnPrint = + "BarFld.Width = SaleAmountMaxFld.Width * " + "(SaleAmountFld / SaleAmountMaxFld)"; |
|
Using C1ReportDesigner:
To draw the actual bars for the chart, set the OnPrint property by completing the following steps:
BarFld.Width = SaleAmountMaxFld.Width * (SaleAmountFld / SaleAmountMaxFld)The following screen capture shows a section of the "Sales Chart" report with the special effects:
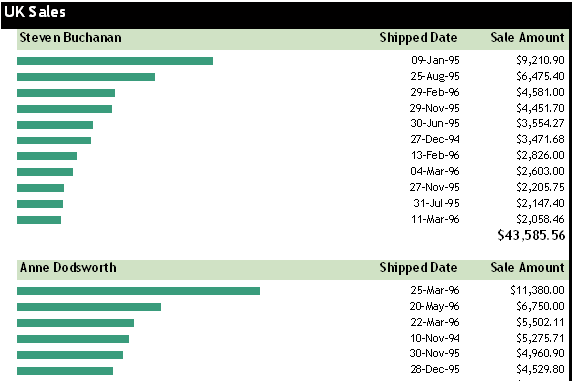
For the complete report, see report "Sales Chart" in the NWind.xml report definition file, which is available as part of the NorthWind sample in the ComponentOne Samples folder.