Most of the chart types are plotted between the two axes, horizontal axis and vertical axis commonly known as X and Y-axis respectively. Often X-axis is used to plot categories and Y-axis to plot values, however in some cases such as bar chart, Y-axis is used as a category axis while X-axis is used as a value axis. Similarly, depending on the data, there are cases when both of the axes are used as value axis. Note that charts such as pie chart, sunburst or treemap are some of the exceptions to this and do not possess any axis.
In FlexChart, the two axes are represented by the AxisX and AxisY property which returns an object of the Axis class.
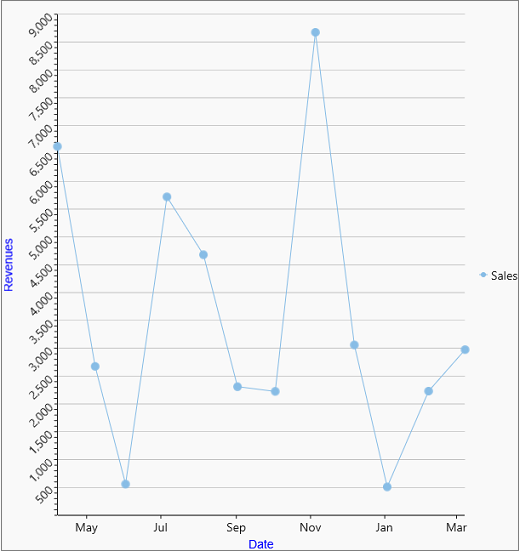
You can configure the X and Y axes by setting the BindingX and Binding property as shown in the following code:
| XAML |
Copy Code
|
|---|---|
<c1:FlexChart x:Name="flexChart" Height="500" BindingX="Date" ChartType="LineSymbols" > <c1:FlexChart.Series> <c1:Series SeriesName="Sales" Binding="Revenue"/> </c1:FlexChart.Series> </c1:FlexChart> |
|
By default, FlexChart renders the X-axis at bottom and Y-axis on left side of the chart. However, you can change the position of these axes to top, right, center etc. by setting the Position property which accepts the values from Position enumeration. Setting this property to None hides the axis itself.
| C# |
Copy Code
|
|---|---|
this.flexChart.AxisY.Position = Position.Right;
|
|
By default, FlexChart displays axis line for X-axis but doesn't display the same for Y-axis. To toggle the visibility of axis lines, you need to set the AxisLine property of the target axis.
| C# |
Copy Code
|
|---|---|
this.flexChart.AxisY.AxisLine = true; |
|
Axis bounds or scale is an essential factor in determining how do you want to present your data and your audience to interpret it. Although FlexChart automatically creates an appropriate scale based on the data provided to it, you can also modify the scale by setting the Min and Max properties. Clearly, the concept of axis scale is only applicable to the value axis and is not valid for a categorical axis.
| C# |
Copy Code
|
|---|---|
this.flexChart.AxisY.Max = 9000; this.flexChart.AxisY.Min = 0; |
|
In some cases, flipping an axis to start displaying the values from maximum to minimum helps in better presentation of data such as height of various waterfalls or depth of an ocean at different levels. FlexChart lets you display the reversed axis by setting the Reversed property to True.
| C# |
Copy Code
|
|---|---|
this.flexChart.AxisY.Reversed = true; |
|
Style an AxisFlexChart allows you to customize the axis lines and make your charts look attractive and in sync with rest of the application UI. The Axis class of FlexChart provides Style property that can be accessed to change the stroke color, stroke width, line pattern etc. of an axis.
| C# |
Copy Code
|
|---|---|
//Setting color to be used for stroke this.flexChart.AxisX.Style.Stroke = new SolidColorBrush() { Color = Windows.UI.Color.FromArgb(255, 0, 0, 255) }; //Setting thickness to be used for stroke width this.flexChart.AxisX.Style.StrokeThickness = 2; //Setting pattern to be used line pattern this.flexChart.AxisX.Style.LinePattern = LinePatternEnum.DashDot; |
|
Apart from the features mentioned above, FlexChart also provides you options to customize axis elements such as titles, tick marks, units etc. and axis labels. You can also group the axis for better analysis and presentation needs. Following sections discuss more about these features related to axis and axis elements.