By default, chart axes appear behind the chart data. However, FlexChart allows you to control the appearance of gridlines and draw them in front of the chart data using the AxesOnTop property of the FlexChart class.
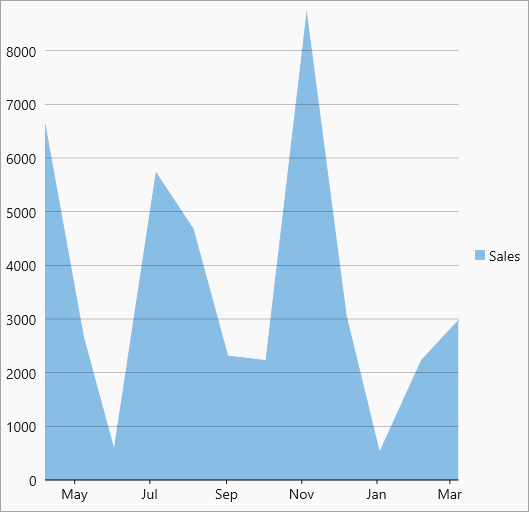
The following code showcases how to draw gridlines on top of chart data at runtime.
| CS |
Copy Code
|
|---|---|
<c1:FlexChart x:Name="flexChart" AxesOnTop="True" BindingX="Date" ChartType="Area" Grid.Row="1" Height="500"> <c1:FlexChart.Series> <c1:Series SeriesName="Sales" Binding="Revenue"/> </c1:FlexChart.Series> </c1:FlexChart> |
|