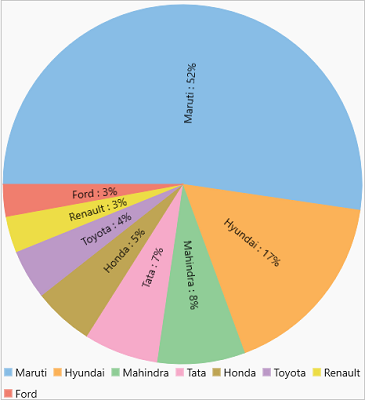
Pie charts, the most common tools used for data visualization, are circular graphs that display the proportionate contribution of each category which is represented by a pie or a slice. The magnitude of the dependent variable is proportional to the angle of the slice. These charts can be used for plotting just one series with non-zero and positive values. For example, you can use a pie chart to show the market share of various automobile companies.
To create a Pie chart through code, follow these steps:
| XAML |
Copy Code
|
|---|---|
<c1:FlexPie x:Name="flexPie" Binding="Value" BindingName="Name" LegendPosition="Bottom" Height="500" > <c1:FlexPie.DataLabel> <c1:PieDataLabel Content=" {name} : {p:0}%" Position="Radial"/> </c1:FlexPie.DataLabel> </c1:FlexPie> |
|
| C# |
Copy Code
|
|---|---|
flexPie.ItemsSource = DataService.GetCarSales(); |
|