Spread ASP.NET 17
FarPoint.Web.Chart Assembly / FarPoint.Web.Chart Namespace / XYPlotArea Class
Members


In This Topic
    XYPlotArea Class
    In This Topic
    Represents an XY plot area in a chart model.
    Object Model
    XYPlotArea ClassWall ClassWall ClassLightCollection ClassLight ClassProjection ClassSeriesCollection ClassSeries ClassWall ClassValueAxisCollection ClassValueAxis ClassValueAxisCollection ClassValueAxis ClassIndexAxis Class
    Syntax
    'Declaration
     
    
    Public Class XYPlotArea 
       Inherits PlotArea
    'Usage
     
    
    Dim instance As XYPlotArea
    public class XYPlotArea : PlotArea 
    Remarks
    The plot area has an x-axis, a y-axis, a z-axis, and up to six walls. The x-axis and y-axis represent values. The z-axis represents series.
    Inheritance Hierarchy

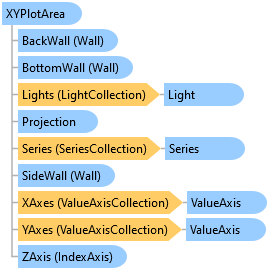
    System.Object
       FarPoint.Web.Chart.PlotArea
          FarPoint.Web.Chart.XYPlotArea

    See Also