The market data (high-low) charts are another version of the one-dimensional Cartesian plot (Y plot) specifically designed for displaying market data often with high and low values as well as market open and market close values. For example:
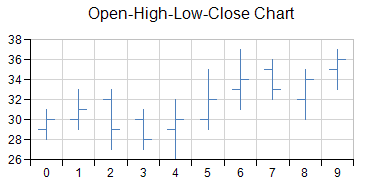
The normal high-low series are displayed as vertical lines with the high value being the vertically highest point on the line and the low value being the lowest point on the line. The opening market value is the small horizontal tick on the left of the line and the closing value is the small horizontal tick on the right side.
A high-low bar series can have a border, fill effect, width, and depth for the bars. Each point can be assigned a border and a fill effect for the bar.
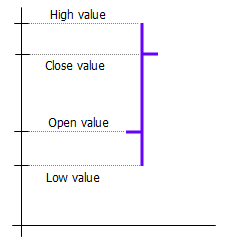
An open-high-low-close series can be assigned a line for up or down points, and a width. The width is measured relative to the floor grid cell (0 = no depth, 1 = width to edge of grid cell).
Each point in an open-high-low-close series contains four data values: open, high, low, close. Each point is visualized as a line extending from the low value to the high value with smaller markers at the open and close values.
The candlestick high-low series are displayed as bars with the high value being the vertically highest point on the bar and the low value being the lowest point on the bar. If it is solid, then the opening value was lower; if it is hollow, the opening value was higher.
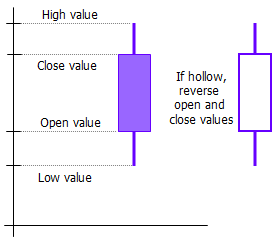
A candlestick series can be assigned a border and a fill effect for up or down points. You can also set the width and depth for the bars.
Each point in a candlestick series contains four values: open, high, low, and close. Each point is visualized as a line extending from the low value to the high value and a bar extending from the open value to the close value.
Each point can be assigned a border for up and down points. You can also set a fill effect for up and down points.
For more information on the objects in the API, refer to these classes: