The Y plot area contains series that have values in one dimension.
When visualized in two dimensions, a Y plot area takes the form of a rectangle with the x-axis representing categories and the y-axis representing values.
When visualized in three dimensions, a Y plot area takes the form of a cube with the x-axis representing categories, the y-axis representing values, and the z-axis (depth) representing series.
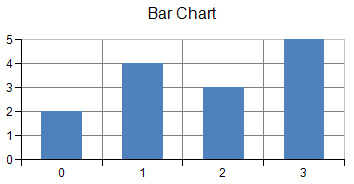
A Y plot area can be oriented vertically or horizontally. When oriented vertically, the x-axis is horizontal and the y-axis is vertical. When oriented horizontally, the x-axis is vertical and the y-axis is horizontal. The following image shows a bar chart:
You can have any of these types of Y plots: