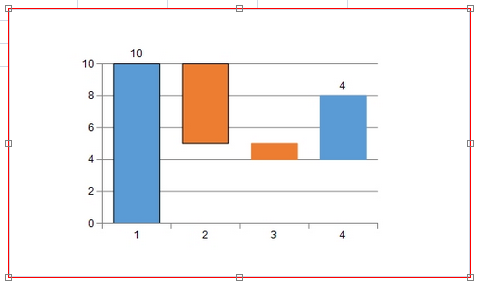
A waterfall chart can be used to show how an initial value is affected by negative or positive values. Columns are color coded so you can quickly see differences between positive and negative values. Some values start on the horizontal axis, while intermediate values are shown as floating columns.
For information about creating charts in the Spread Designer or the Chart Designer, refer to Using the Spread Designer or Using the Chart Designer.
The following example creates a waterfall chart.
| C# |
Copy Code
|
|---|---|
FarPoint.Web.Chart.WaterfallSeries wseries = new FarPoint.Web.Chart.WaterfallSeries(); wseries.SeriesName = "Series0"; wseries.Values.Add(10); wseries.Values.Add(-5); wseries.Values.Add(-1); wseries.Values.Add(4); wseries.Borders.Add(new FarPoint.Web.Chart.SolidLine(System.Drawing.Color.Black)); wseries.Borders.Add(new FarPoint.Web.Chart.SolidLine(System.Drawing.Color.Black)); FarPoint.Web.Chart.YPlotArea plotArea = new FarPoint.Web.Chart.YPlotArea(); plotArea.Location = new System.Drawing.PointF(0.2f, 0.2f); plotArea.Size = new System.Drawing.SizeF(0.6f, 0.6f); plotArea.Series.Add(wseries); FarPoint.Web.Chart.ChartModel model = new FarPoint.Web.Chart.ChartModel(); model.PlotAreas.Add(plotArea); FarPoint.Web.Spread.Chart.SpreadChart chart = new FarPoint.Web.Spread.Chart.SpreadChart(); chart.Model = model; FpSpread1.Sheets[0].Charts.Add(chart); |
|
| VB |
Copy Code
|
|---|---|
Dim wseries = New FarPoint.Web.Chart.WaterfallSeries() wseries.SeriesName = "Series0" wseries.Values.Add(10) wseries.Values.Add(-5) wseries.Values.Add(-1) wseries.Values.Add(4) wseries.Borders.Add(New FarPoint.Web.Chart.SolidLine(System.Drawing.Color.Black)) wseries.Borders.Add(New FarPoint.Web.Chart.SolidLine(System.Drawing.Color.Black)) Dim plotArea As New FarPoint.Web.Chart.YPlotArea() plotArea.Location = New System.Drawing.PointF(0.2F, 0.2F) plotArea.Size = New System.Drawing.SizeF(0.6F, 0.6F) plotArea.Series.Add(wseries) Dim model As New FarPoint.Web.Chart.ChartModel() model.PlotAreas.Add(plotArea) Dim chart As New FarPoint.Web.Spread.Chart.SpreadChart() chart.Model = model FpSpread1.Sheets(0).Charts.Add(chart) |
|