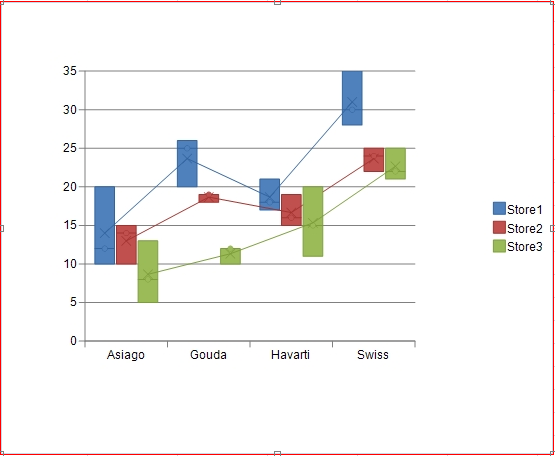
A box whisker chart displays the distribution of data into quartiles. The boxes may also have lines extending vertically (whiskers). The lines indicate variability outside the upper and lower quartiles. A point outside the whisker is an outlier point. Box whisker charts are commonly used in statistical analysis.
You can use the BoxWhiskerSeries, the ClusteredBoxWhiskerSeries, and the YPlotArea classes to create a box whisker chart with multiple series as shown in the following image.
For information about creating charts in the Spread Designer or the Chart Designer, refer to Using the Spread Designer or Using the Chart Designer.
This example creates a box whisker chart.
| C# |
Copy Code
|
|---|---|
| FpSpread1.ActiveSheetView.RowCount = 25; FpSpread1.ActiveSheetView.ColumnCount = 15; FpSpread1.ActiveSheetView.PageSize = 25; FpSpread1.ActiveSheetView.Cells[0, 1].Text = "Cheese"; FpSpread1.ActiveSheetView.Cells[0, 2].Text = "Store1"; FpSpread1.ActiveSheetView.Cells[0, 3].Text = "Store2"; FpSpread1.ActiveSheetView.Cells[0, 4].Text = "Store3"; FpSpread1.ActiveSheetView.Cells[1, 1].Text = "Asiago"; FpSpread1.ActiveSheetView.Cells[2, 1].Text = "Gouda"; FpSpread1.ActiveSheetView.Cells[3, 1].Text = "Havarti"; FpSpread1.ActiveSheetView.Cells[4, 1].Text = "Swiss"; FpSpread1.ActiveSheetView.Cells[5, 1].Text = "Asiago"; FpSpread1.ActiveSheetView.Cells[6, 1].Text = "Gouda"; FpSpread1.ActiveSheetView.Cells[7, 1].Text = "Havarti"; FpSpread1.ActiveSheetView.Cells[8, 1].Text = "Swiss"; FpSpread1.ActiveSheetView.Cells[9, 1].Text = "Asiago"; FpSpread1.ActiveSheetView.Cells[10, 1].Text = "Gouda"; FpSpread1.ActiveSheetView.Cells[11, 1].Text = "Havarti"; FpSpread1.ActiveSheetView.Cells[12, 1].Text = "Swiss"; FpSpread1.ActiveSheetView.Cells[1, 2].Value = 20; FpSpread1.ActiveSheetView.Cells[2, 2].Value = 25; FpSpread1.ActiveSheetView.Cells[3, 2].Value = 21; FpSpread1.ActiveSheetView.Cells[4, 2].Value = 30; FpSpread1.ActiveSheetView.Cells[5, 2].Value = 10; FpSpread1.ActiveSheetView.Cells[6, 2].Value = 26; FpSpread1.ActiveSheetView.Cells[7, 2].Value = 18; FpSpread1.ActiveSheetView.Cells[8, 2].Value = 28; FpSpread1.ActiveSheetView.Cells[9, 2].Value = 12; FpSpread1.ActiveSheetView.Cells[10, 2].Value = 20; FpSpread1.ActiveSheetView.Cells[11, 2].Value = 17; FpSpread1.ActiveSheetView.Cells[12, 2].Value = 35; FpSpread1.ActiveSheetView.Cells[1, 3].Value = 15; FpSpread1.ActiveSheetView.Cells[2, 3].Value = 18; FpSpread1.ActiveSheetView.Cells[3, 3].Value = 19; FpSpread1.ActiveSheetView.Cells[4, 3].Value = 22; FpSpread1.ActiveSheetView.Cells[5, 3].Value = 10; FpSpread1.ActiveSheetView.Cells[6, 3].Value = 19; FpSpread1.ActiveSheetView.Cells[7, 3].Value = 15; FpSpread1.ActiveSheetView.Cells[8, 3].Value = 25; FpSpread1.ActiveSheetView.Cells[9, 3].Value = 14; FpSpread1.ActiveSheetView.Cells[10, 3].Value = 19; FpSpread1.ActiveSheetView.Cells[11, 3].Value = 16; FpSpread1.ActiveSheetView.Cells[12, 3].Value = 24; FpSpread1.ActiveSheetView.Cells[1, 4].Value = 5; FpSpread1.ActiveSheetView.Cells[2, 4].Value = 12; FpSpread1.ActiveSheetView.Cells[3, 4].Value = 20; FpSpread1.ActiveSheetView.Cells[4, 4].Value = 25; FpSpread1.ActiveSheetView.Cells[5, 4].Value = 8; FpSpread1.ActiveSheetView.Cells[6, 4].Value = 10; FpSpread1.ActiveSheetView.Cells[7, 4].Value = 11; FpSpread1.ActiveSheetView.Cells[8, 4].Value = 22; FpSpread1.ActiveSheetView.Cells[9, 4].Value = 13; FpSpread1.ActiveSheetView.Cells[10, 4].Value = 12; FpSpread1.ActiveSheetView.Cells[11, 4].Value = 15; FpSpread1.ActiveSheetView.Cells[12, 4].Value = 21; FpSpread1.ActiveSheetView.AddChart(new FarPoint.Web.Spread.Model.CellRange(0, 1, 13, 4), typeof(FarPoint.Web.Chart.ClusteredBoxWhiskerSeries), 550, 450, 300, 0); FarPoint.Web.Chart.ClusteredBoxWhiskerSeries cboxseries = (FarPoint.Web.Chart.ClusteredBoxWhiskerSeries)FpSpread1.Sheets[0].Charts[0].Model.PlotAreas[0].Series[0]; foreach (FarPoint.Web.Chart.BoxWhiskerSeries boxseries in cboxseries.Series) { boxseries.ShowInnerPoints = true; boxseries.ShowMeanLine = true; boxseries.ShowMeanMarkers = true; boxseries.ShowOutlierPoints = true; } |
|
| VB |
Copy Code
|
|---|---|
| FpSpread1.ActiveSheetView.RowCount = 25 FpSpread1.ActiveSheetView.ColumnCount = 15 FpSpread1.ActiveSheetView.PageSize = 25 FpSpread1.ActiveSheetView.Cells(0, 1).Text = "Cheese" FpSpread1.ActiveSheetView.Cells(0, 2).Text = "Store1" FpSpread1.ActiveSheetView.Cells(0, 3).Text = "Store2" FpSpread1.ActiveSheetView.Cells(0, 4).Text = "Store3" FpSpread1.ActiveSheetView.Cells(1, 1).Text = "Asiago" FpSpread1.ActiveSheetView.Cells(2, 1).Text = "Gouda" FpSpread1.ActiveSheetView.Cells(3, 1).Text = "Havarti" FpSpread1.ActiveSheetView.Cells(4, 1).Text = "Swiss" FpSpread1.ActiveSheetView.Cells(5, 1).Text = "Asiago" FpSpread1.ActiveSheetView.Cells(6, 1).Text = "Gouda" FpSpread1.ActiveSheetView.Cells(7, 1).Text = "Havarti" FpSpread1.ActiveSheetView.Cells(8, 1).Text = "Swiss" FpSpread1.ActiveSheetView.Cells(9, 1).Text = "Asiago" FpSpread1.ActiveSheetView.Cells(10, 1).Text = "Gouda" FpSpread1.ActiveSheetView.Cells(11, 1).Text = "Havarti" FpSpread1.ActiveSheetView.Cells(12, 1).Text = "Swiss" FpSpread1.ActiveSheetView.Cells(1, 2).Value = 20 FpSpread1.ActiveSheetView.Cells(2, 2).Value = 25 FpSpread1.ActiveSheetView.Cells(3, 2).Value = 21 FpSpread1.ActiveSheetView.Cells(4, 2).Value = 30 FpSpread1.ActiveSheetView.Cells(5, 2).Value = 10 FpSpread1.ActiveSheetView.Cells(6, 2).Value = 26 FpSpread1.ActiveSheetView.Cells(7, 2).Value = 18 FpSpread1.ActiveSheetView.Cells(8, 2).Value = 28 FpSpread1.ActiveSheetView.Cells(9, 2).Value = 12 FpSpread1.ActiveSheetView.Cells(10, 2).Value = 20 FpSpread1.ActiveSheetView.Cells(11, 2).Value = 17 FpSpread1.ActiveSheetView.Cells(12, 2).Value = 35 FpSpread1.ActiveSheetView.Cells(1, 3).Value = 15 FpSpread1.ActiveSheetView.Cells(2, 3).Value = 18 FpSpread1.ActiveSheetView.Cells(3, 3).Value = 19 FpSpread1.ActiveSheetView.Cells(4, 3).Value = 22 FpSpread1.ActiveSheetView.Cells(5, 3).Value = 10 FpSpread1.ActiveSheetView.Cells(6, 3).Value = 19 FpSpread1.ActiveSheetView.Cells(7, 3).Value = 15 FpSpread1.ActiveSheetView.Cells(8, 3).Value = 25 FpSpread1.ActiveSheetView.Cells(9, 3).Value = 14 FpSpread1.ActiveSheetView.Cells(10, 3).Value = 19 FpSpread1.ActiveSheetView.Cells(11, 3).Value = 16 FpSpread1.ActiveSheetView.Cells(12, 3).Value = 24 FpSpread1.ActiveSheetView.Cells(1, 4).Value = 5 FpSpread1.ActiveSheetView.Cells(2, 4).Value = 12 FpSpread1.ActiveSheetView.Cells(3, 4).Value = 20 FpSpread1.ActiveSheetView.Cells(4, 4).Value = 25 FpSpread1.ActiveSheetView.Cells(5, 4).Value = 8 FpSpread1.ActiveSheetView.Cells(6, 4).Value = 10 FpSpread1.ActiveSheetView.Cells(7, 4).Value = 11 FpSpread1.ActiveSheetView.Cells(8, 4).Value = 22 FpSpread1.ActiveSheetView.Cells(9, 4).Value = 13 FpSpread1.ActiveSheetView.Cells(10, 4).Value = 12 FpSpread1.ActiveSheetView.Cells(11, 4).Value = 15 FpSpread1.ActiveSheetView.Cells(12, 4).Value = 21 FpSpread1.ActiveSheetView.AddChart(New FarPoint.Web.Spread.Model.CellRange(0, 1, 13, 4), GetType(FarPoint.Web.Chart.ClusteredBoxWhiskerSeries), 550, 450, 300, 0) Dim cboxseries As FarPoint.Web.Chart.ClusteredBoxWhiskerSeries = DirectCast(FpSpread1.Sheets(0).Charts(0).Model.PlotAreas(0).Series(0), FarPoint.Web.Chart.ClusteredBoxWhiskerSeries) For Each boxseries As FarPoint.Web.Chart.BoxWhiskerSeries In cboxseries.Series boxseries.ShowInnerPoints = True boxseries.ShowMeanLine = True boxseries.ShowMeanMarkers = True boxseries.ShowOutlierPoints = True Next |
|