You can add a sparkline to a cell using code or the designer.
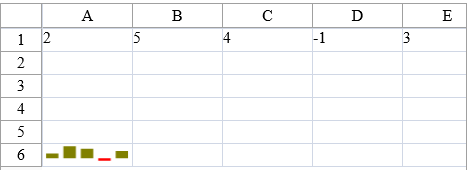
This example creates a column sparkline in a cell and shows negative and series colors.
| C# |
Copy Code
|
|---|---|
FarPoint.Web.Spread.SheetView sv = new FarPoint.Web.Spread.SheetView(); FarPoint.Web.Spread.Chart.SheetCellRange data = new FarPoint.Web.Spread.Chart.SheetCellRange(sv, 0,0,1, 5); FarPoint.Web.Spread.Chart.SheetCellRange data2 = new FarPoint.Web.Spread.Chart.SheetCellRange(sv, 5,0,1,1); FarPoint.Web.Spread.ExcelSparklineSetting ex = new FarPoint.Web.Spread.ExcelSparklineSetting(); ex.ShowMarkers = true; ex.ShowNegative = true; ex.NegativeColor = Color.Red; // Use with a Column or Winloss type ex.SeriesColor = Color.Olive; fpSpread1.Sheets[0] = sv; fpSpread1.Sheets[0].RowCount = 6; fpSpread1.Sheets[0].ColumnCount = 6; sv.Cells[0, 0].Value = 2; sv.Cells[0, 1].Value = 5; sv.Cells[0, 2].Value = 4; sv.Cells[0, 3].Value = -1; sv.Cells[0, 4].Value = 3; fpSpread1.Sheets[0].AddSparkline(data, data2, FarPoint.Web.Spread.SparklineType.Column, ex); |
|
| VB |
Copy Code
|
|---|---|
Dim sv As New FarPoint.Web.Spread.SheetView() Dim data As New FarPoint.Web.Spread.Chart.SheetCellRange(sv, 0, 0, 1, 5) Dim data2 As New FarPoint.Web.Spread.Chart.SheetCellRange(sv, 5, 0, 1, 1) Dim ex As New FarPoint.Web.Spread.ExcelSparklineSetting() ex.ShowMarkers = True ex.ShowNegative = True ex.NegativeColor = Color.Red ' Use with a Column or Winloss type ex.SeriesColor = Color.Olive FpSpread1.Sheets(0) = sv FpSpread1.Sheets(0).RowCount = 6 FpSpread1.Sheets(0).ColumnCount = 6 sv.Cells(0, 0).Value = 2 sv.Cells(0, 1).Value = 5 sv.Cells(0, 2).Value = 4 sv.Cells(0, 3).Value = -1 sv.Cells(0, 4).Value = 3 FpSpread1.Sheets(0).AddSparkline(data, data2, FarPoint.Web.Spread.SparklineType.Column, ex) |
|