You can create a small graph in a cell that uses data from a range of cells. The data for the sparkline is limited to one column or row of values. You can set the sparkline type to column, line, or winloss, as shown in the following figure. The images were created using a minimum axis of -9 and a maximum axis of 15.
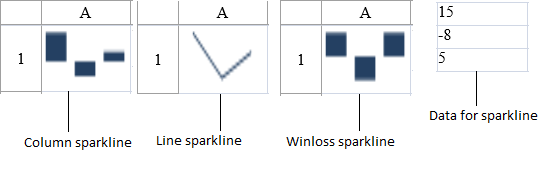
The column sparkline draws the values as a column chart. The line sparkline draws the values as a line chart. The winloss sparkline shows the points with the same size. Negative points extend down from the axis and positive points extend up.
The graphs can display colors for the marker points. You can set colors for the high, low, negative, first, and last points.
The graphs have horizontal and vertical axes.
Sparklines are stored as groups. A group contains at least one sparkline.
The Sparkline graph requires the following information in the web.config file. This example is based on IIS7.
| Code |
Copy Code
|
|---|---|
<system.webServer> <validation validateIntegratedModeConfiguration="false"/> <handlers> ... <add name="chart" path="FpChart.axd" verb="*" type="FarPoint.Web.Chart.ChartImageHttpHandler"/> </handlers> // If you are using integrated managed pipeline mode, //set validateIntegratedModeConfiguration to false. <validation validateIntegratedModeConfiguration="false"/> |
|
This example is based on IIS8.
| Code |
Copy Code
|
|---|---|
<system.webServer>
    <handlers>
      <add name="FpChart" verb="*" path="FpChart.axd" preCondition="integratedMode" type="FarPoint.Web.Chart.ChartImageHttpHandler"/>
    </handlers>
    <validation validateIntegratedModeConfiguration="false"/>
  </system.webServer>
|
|
For more information, see the following topics: