In This Topic
Error bars are graphical elements that are used to display the variability of data points. By using the ErrorBars class properties and associated enums, you can add and customize error bars according to your specific requirements, ensuring an accurate representation of data in charts. Spread also provides support for import and export error bars in charts from/to XML and Excel formats.
To determine the direction of the error bars concerning the axes, use the ErrorBarDirection enum. It offers two values:
- X: Indicates that the bars run parallel to the Y-axis for X-axis values.
- Y: Indicates that the bars run parallel to the X-axis for Y-axis values.
Using the ErrorBarType enum, you can define the type of error bars. It includes three values:
- Minus: Represents an error bar with a negative error range.
- Plus: Represents an error bar with a positive error range.
- Both: Represents an error bar with both positive and negative error ranges.
To define the type of error value, use the ErrorBarValueType enum which consists of four values:
- FixedValue: Represents the error as an absolute value.
- Percentage: Represents the error as a percentage.
- StandardDeviation: Represents the error as a number of standard deviations.
- StandardError: Represents a standard error value.
Spread lets you use Error Bars in different chart series, such as:
- BarSeries
- LineSeries
- AreaSeries
- XYLineSeries
- XYPointSeries
- ClusteredBarSeries
- HighLowCloseSeries
- CandlestickSeries
Using Code
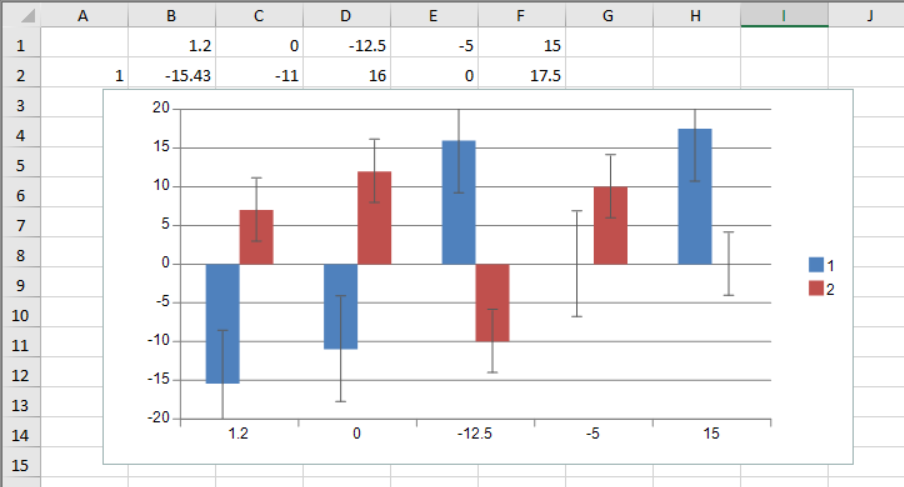
The following sample code shows how to implement ErrorBar in ClusteredBarSeries in Spread.
The following image depicts the output of the above code.
Customizing Error Bars in Spread Chart Designer
Spread provides functionality to customize error bars properties within the Chart Designer. Follow the steps below to access and modify error bars settings:
- Right-click on the chart in the Spread Designer.
- Click Chart Designer... from the menu that opens the Spread Chart Designer dialog.
- From the left side panel, locate and click the Error Bars on which you want to make the changes.
When selected, the property list will appear on the right side of the dialog.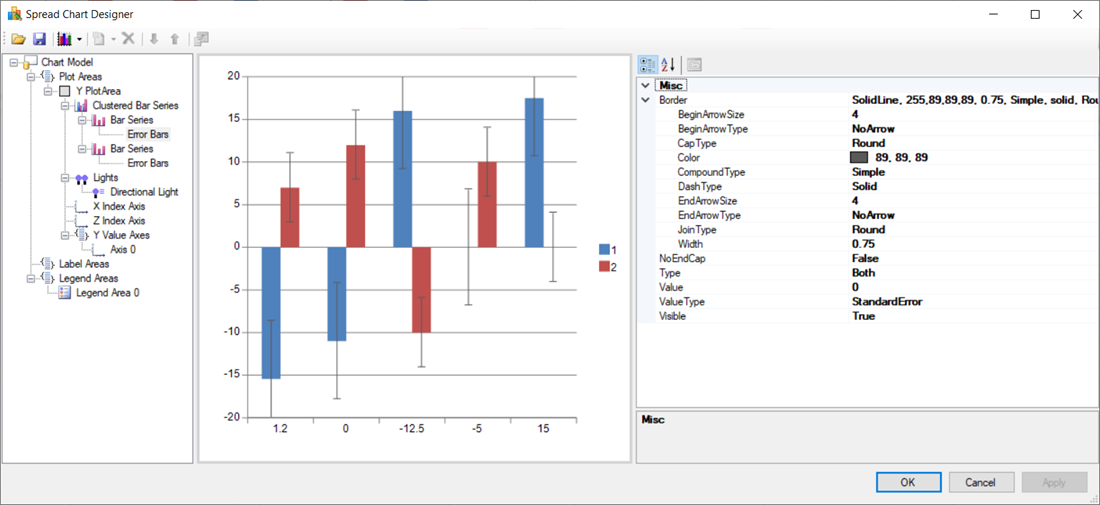
- Customize the error bars values according to your requirements using the provided properties.
Limitations
- Spread Designer does not support interactive user interface customization of error bars.
- Currently, the ErrorBarValueType.Custom enum is not supported for customization.
See Also