The labels contain the plot title and the axis labels.
You can set the main title for the chart using the Text property in the LabelArea class.
You can set the text, alignment, and other formatting properties for the axis labels. See the following for more information:
The label text can be bound to a data source with the TitleDataSource and TitleDataField properties.
The following example sets the chart and axis title.
| C# |
Copy Code
|
|---|---|
FarPoint.Win.Chart.YPlotArea plotArea = new FarPoint.Win.Chart.YPlotArea(); plotArea.Location = new System.Drawing.PointF(0.2f, 0.2f); plotArea.Size = new System.Drawing.SizeF(0.6f, 0.6f); //Sets the Axis label plotArea.XAxis.Title = "Categories"; plotArea.YAxes[0].Title = "Values"; plotArea.YAxes[0].TitleTextDirection = FarPoint.Win.Chart.TextDirection.Rotate270Degree; plotArea.Series.Add(series1); //Sets chart title FarPoint.Win.Chart.LabelArea labelArea = new FarPoint.Win.Chart.LabelArea(); labelArea.Location = new System.Drawing.PointF(0.5f, 0.02f); labelArea.AlignmentX = 0.5f; labelArea.AlignmentY = 0.0f; labelArea.Text = "The Chart"; |
|
| Visual Basic |
Copy Code
|
|---|---|
Dim plotArea As New FarPoint.Win.Chart.YPlotArea() plotArea.Location = New System.Drawing.PointF(0.2F, 0.2F) plotArea.Size = New System.Drawing.SizeF(0.6F, 0.6F) 'Sets the Axis label plotArea.XAxis.Title = "Categories" plotArea.YAxes(0).Title = "Values" plotArea.YAxes(0).TitleTextDirection = FarPoint.Win.Chart.TextDirection.Rotate270Degree plotArea.Series.Add(series1) 'Sets chart title Dim labelArea As New FarPoint.Win.Chart.LabelArea() labelArea.Location = New System.Drawing.PointF(0.5F, 0.02F) labelArea.AlignmentX = 0.5F labelArea.AlignmentY = 0F labelArea.Text = "The Chart" |
|
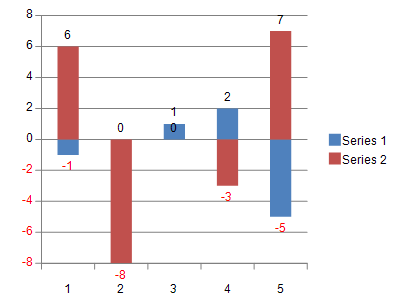
The negative data label values and value axis labels of a chart can be displayed in red color.
The Series.LabelNegativeRed and ValueAxis.LabelNegativeRed properties can be set to True to display the negative values in red.
The properties show the following behavior:
The following code shows how to apply LabelNegativeRed property to display negative label values in red.
| C# |
Copy Code
|
|---|---|
var worksheet = fpSpread1_Sheet1.AsWorksheet(); worksheet.Cells[0, 0].Value = -1; worksheet.Cells[1, 0].Value = 0; worksheet.Cells[2, 0].Value = 1; worksheet.Cells[3, 0].Value = 2; worksheet.Cells[4, 0].Value = -5; worksheet.Cells[0, 1].Value = 6; worksheet.Cells[1, 1].Value = -8; worksheet.Cells[2, 1].Value = 0; worksheet.Cells[3, 1].Value = -3; worksheet.Cells[4, 1].Value = 7; FarPoint.Win.Spread.Model.CellRange range = new FarPoint.Win.Spread.Model.CellRange(0, 0, 5, 2); FarPoint.Win.Spread.Chart.SpreadChart chart = fpSpread1.Sheets[0].AddChart(range, typeof(FarPoint.Win.Chart.BarSeries), 400, 300, 200, 50); FarPoint.Win.Chart.BarSeries series = (FarPoint.Win.Chart.BarSeries)chart.Model.PlotAreas[0].Series[0]; FarPoint.Win.Chart.BarSeries series1 = (FarPoint.Win.Chart.BarSeries)chart.Model.PlotAreas[0].Series[1]; // Setting label visible for data label in series 0 series.LabelVisible = true; series.LabelNegativeRed = true; // Setting LabelNegativeRed as true // Setting label visible for data label in series 1 series1.LabelVisible = true; series1.LabelNegativeRed = true; FarPoint.Win.Chart.YPlotArea plotArea = (FarPoint.Win.Chart.YPlotArea)chart.Model.PlotAreas[0]; // Setting label visible for value axis plotArea.YAxes[0].LabelVisible = true; plotArea.YAxes[0].LabelNegativeRed = true; // Setting LabelNegativeRed as true |
|
| Visual Basic |
Copy Code
|
|---|---|
Dim worksheet = FpSpread1_Sheet1.AsWorksheet() worksheet.Cells(0, 0).Value = -1 worksheet.Cells(1, 0).Value = 0 worksheet.Cells(2, 0).Value = 1 worksheet.Cells(3, 0).Value = 2 worksheet.Cells(4, 0).Value = -5 worksheet.Cells(0, 1).Value = 6 worksheet.Cells(1, 1).Value = -8 worksheet.Cells(2, 1).Value = 0 worksheet.Cells(3, 1).Value = -3 worksheet.Cells(4, 1).Value = 7 Dim range As FarPoint.Win.Spread.Model.CellRange = New FarPoint.Win.Spread.Model.CellRange(0, 0, 5, 2) Dim chart As FarPoint.Win.Spread.Chart.SpreadChart = FpSpread1.Sheets(0).AddChart(range, GetType(FarPoint.Win.Chart.BarSeries), 400, 300, 200, 50) Dim series As FarPoint.Win.Chart.BarSeries = CType(chart.Model.PlotAreas(0).Series(0), FarPoint.Win.Chart.BarSeries) Dim series1 As FarPoint.Win.Chart.BarSeries = CType(chart.Model.PlotAreas(0).Series(1), FarPoint.Win.Chart.BarSeries) 'Setting label visible for data label in series 0 series.LabelVisible = True series.LabelNegativeRed = True 'Setting LabelNegativeRed as true 'Setting label visible for data label in series 1 series1.LabelVisible = True series1.LabelNegativeRed = True 'Setting LabelNegativeRed as true Dim plotArea As FarPoint.Win.Chart.YPlotArea = CType(chart.Model.PlotAreas(0), FarPoint.Win.Chart.YPlotArea) 'Setting label visible for value axis plotArea.YAxes(0).LabelVisible = True plotArea.YAxes(0).LabelNegativeRed = True 'Setting LabelNegativeRed as true |
|
ExcelIO supports negative red numbers by using the general formatter property. For example, you can use the following format code "#,0;[Red]-#,0" in Spread before exporting to Excel, where the positive and negative formats are separated by a semi-colon and the negative values are set to display in red.
The following code shows how to export a chart and display negative label values in red.
| C# |
Copy Code
|
|---|---|
// To export negative values in red FarPoint.Win.Spread.Model.GeneralFormatter formatter = new FarPoint.Win.Spread.Model.GeneralFormatter(); formatter.SetFormatString("#,0;[Red]-#,0", false); series.LabelFormatter = formatter; fpSpread1.SaveExcel("label-chart.xlsx", FarPoint.Excel.ExcelSaveFlags.UseOOXMLFormat | FarPoint.Excel.ExcelSaveFlags.Exchangeable); |
|
| Visual Basic |
Copy Code
|
|---|---|
'To export negative values in red Dim formatter As FarPoint.Win.Spread.Model.GeneralFormatter = New FarPoint.Win.Spread.Model.GeneralFormatter() formatter.SetFormatString("#,0;[Red]-#,0", False) series.LabelFormatter = formatter FpSpread1.SaveExcel("label-chart.xlsx", FarPoint.Excel.ExcelSaveFlags.UseOOXMLFormat Or FarPoint.Excel.ExcelSaveFlags.Exchangeable) |
|
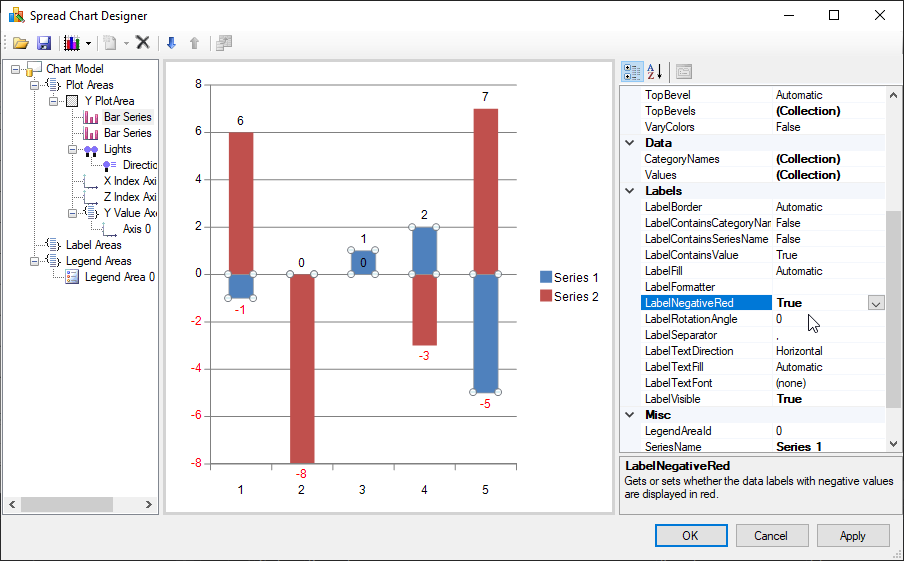
You can also enable showing negative labels in red in the Chart Designer by selecting the Bar Series target from the tree menu on the left and enable the LabelNegativeRed option to True on the property list.