A DataTable is a range in which you can modify the values in some of the cells and come up with different solutions to a problem. The DataTable feature helps in performing what-if analysis in worksheets, a process in which changing the values in cells affects the outcome of the worksheet formulas. It can be used in financial data analysis, for example, to experiment with different values and observe the corresponding variation in results. A good example of a data table uses the PMT function with different loan amounts and interest rates to calculate the affordable amount on a mortgage loan.
The DataTable formula can be applied to a range of cells using the DataTable method of IRange interface, which creates a data table based on the input values and formulas that you define on a worksheet.
The DataTable method accepts the following parameters:
Depending on the number of variables and formulas that you need to test, there are one-variable and two-variable data tables.
To see how different values of one variable in one or more formulas impact the results of those formulas, you can use a one-variable data table.
In the following image, cell F2 contains the payments formula PMT(B3/12,B2,-B1), which refers to the input cell B3. The DataTable is set for Range E2:F7. Here, the DataTable method creates a data table based on column input value in cell B3 and the formula defined in the cell F2. Since the data table is column-oriented, that is, the variable values are in a column, the formula in the cell is entered one row above and one cell to the right of the column of values. The image below depicts the one-variable data table that is column-oriented, and the formula is contained in cell F2. Likewise, if the data table is row-oriented, that is, the variable values are arranged in a row, the formula is entered in a cell one column to the left of the first value and one cell below the row of values.
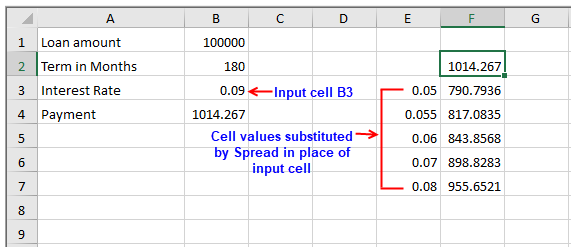
As observed, substituting values in cells, E3, E4, E5, E6 and E7, automatically updates the possible outcomes of Payment values in cells F3, F4, F5, F6 and F7 using the payments formula.
Using Code
| C# |
Copy Code
|
|---|---|
// One-variable data table TestWorkBook.WorkbookSet.CalculationEngine.CalcFeatures = CalcFeatures.All; fpSpread1.Features.ExcelCompatibleKeyboardShortcuts = true; fpSpread1.ActiveSheet.SetClip(0, 0, 4, 1, "Loan amount\nTerm in Months\nInterest Rate\nPayment"); IWorksheet TestActiveSheet = fpSpread1.AsWorkbook().ActiveSheet; TestActiveSheet.Cells[0, 1].Value = 100000; TestActiveSheet.Cells[1, 1].Value = 180; TestActiveSheet.Cells[2, 1].Value = 0.09; TestActiveSheet.Cells[3, 1].Formula = "PMT(B3/12,B2,-B1)"; TestActiveSheet.Cells["F2"].Formula = "B4"; TestActiveSheet.SetValue(2, 4, new object[,] { { 0.05 }, { 0.055 }, { 0.06 }, { 0.07 }, { 0.08 } }); TestActiveSheet.Range("E2:F7").DataTable("", "B3"); |
|
| VB |
Copy Code
|
|---|---|
TestWorkBook.WorkbookSet.CalculationEngine.CalcFeatures = CalcFeatures.All FpSpread1.Features.ExcelCompatibleKeyboardShortcuts = True FpSpread1.ActiveSheet.SetClip(0, 0, 4, 1, "Loan amount" & vbLf & "Term in Months" & vbLf & "Interest Rate" & vbLf & "Payment") IWorksheet TestActiveSheet = FpSpread1.AsWorkbook().ActiveSheet TestActiveSheet.Cells(0, 1).Value = 100000 TestActiveSheet.Cells(1, 1).Value = 180 TestActiveSheet.Cells(2, 1).Value = 0.09 TestActiveSheet.Cells(3, 1).Formula = "PMT(B3/12,B2,-B1)" TestActiveSheet.Cells("F2").Formula = "B4" TestActiveSheet.SetValue(2, 4, New Object(,) {{0.05},{0.055},{0.06},{0.07},{0.08}}) TestActiveSheet.Range("E2:F7").DataTable("", "B3") |
|
A two-variable DataTable uses a formula that contains two lists of input values, column and row. So, the formula must refer to two different input cells.
A two-variable DataTable depict how different combinations of interest rates and loan terms can affect the payment. In the image here, cell E2 contains the payment formula, =PMT(B3/12,B2,-B1), which uses two input cells, B1 and B3. The DataTable method creates data table for the Range E2:J7.
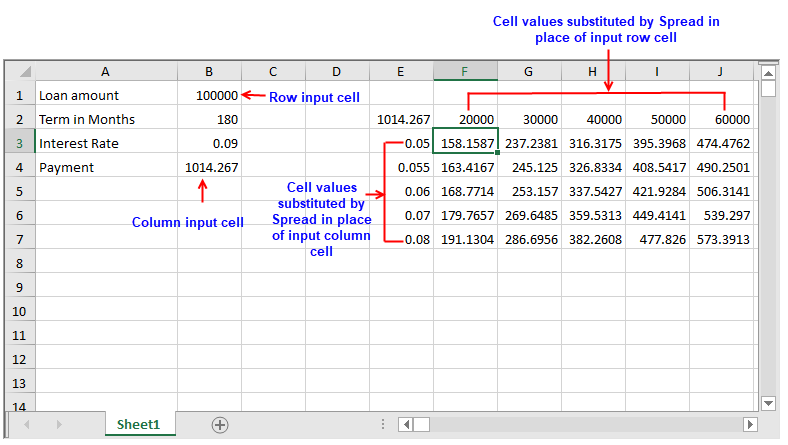
As observed, the variable values are substituted in rows as well as columns. The column input cell B3 substitutes values in cells E3 through E7, while the row input cell B1 substitutes values in cells F2 through J2.
Using Code
| C# |
Copy Code
|
|---|---|
// Two variable data table fpSpread1.AsWorkbook().WorkbookSet.CalculationEngine.CalcFeatures = GrapeCity.Spreadsheet.CalcFeatures.All; fpSpread1.ActiveSheet.SetClip(0, 0, 4, 1, "Loan amount\nTerm in Months\nInterest Rate\nPayment"); IWorksheet TestActiveSheet = fpSpread1.AsWorkbook().ActiveSheet; TestActiveSheet.Cells[0, 1].Value = 100000; TestActiveSheet.Cells[1, 1].Value = 180; TestActiveSheet.Cells[2, 1].Value = 0.09; TestActiveSheet.Cells[3, 1].Formula = "PMT(B3/12,B2,-B1)"; TestActiveSheet.Cells["E2"].Formula = "B4"; TestActiveSheet.SetValue(2, 4, new object[,] { { 0.05 }, { 0.055 }, { 0.06 }, { 0.07 }, { 0.08 } }); TestActiveSheet.SetValue(1, 5, new object[,] { { 20000, 30000, 40000, 50000, 60000 } }); TestActiveSheet.Range("E2:J7").DataTable("B1", "B3"); |
|
| VB |
Copy Code
|
|---|---|
' Two variable data table FpSpread1.AsWorkbook().WorkbookSet.CalculationEngine.CalcFeatures = GrapeCity.Spreadsheet.CalcFeatures.All FpSpread1.ActiveSheet.SetClip(0, 0, 4, 1, "Loan amount\nTerm in Months\nInterest Rate\nPayment") IWorksheet TestActiveSheet = FpSpread1.AsWorkbook().ActiveSheet; TestActiveSheet.Cells(0, 1).Value = 100000 TestActiveSheet.Cells(1, 1).Value = 180 TestActiveSheet.Cells(2, 1).Value = 0.09 TestActiveSheet.Cells(3, 1).Formula = "PMT(B3/12,B2,-B1)" TestActiveSheet.Cells("E2").Formula = "B4" TestActiveSheet.SetValue(2, 4, New Object(,) {{0.05},{0.055},{0.06},{0.07},{0.08}}) TestActiveSheet.SetValue(1, 5, New Object(,) {{20000, 30000, 40000, 50000, 60000}}) TestActiveSheet.Range("E2:J7").DataTable("B1", "B3") |
|
The Data Table dialog can be invoked by navigating to the Data Table option in the What-If Analysis menu of the Spread ribbon.
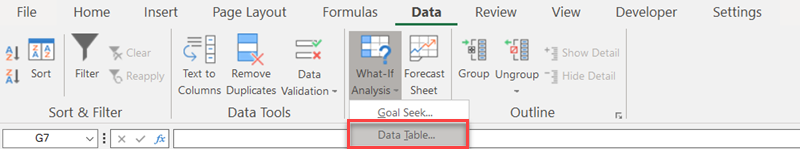
Click the Data Table option to invoke the dialog.
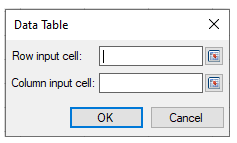
The dialog lets the user enter the desired row input and column input cells to create a data table.
Users can also invoke the Data Table dialog at runtime using the DataTable method in BuiltInDialogs class. Fore more information, see Working with BuiltInDialogs.
The Keyboard shortcut to Data Table dialog is Alt + A + W + T.