
- Getting Started
-
Topics
- Wijmo
-
Chart
- Basic
-
Advanced
- Animation
- Annotations
-
Conditional Formatting
- Data Labels
- Export
- Grouping and Drilldown
- Hit-Testing
- Interpolating Nulls
- Legend and Titles
- Line Markers
- Plot Areas
- Range Selectors
- Selection
- Sorting & Filtering
- Styling Series
- Toggle Series Visibility
- Tooltips
- Zooming
- Financial
- SpecialCharts
- Axes
- Analytics
- Map
- Cloud
- Gauge
- Grid
- OLAP
- Input
- Nav
- Viewer
Conditional Formatting in FlexChart
The FlexChart's itemFormatter property allows you to specify a callback function invoked when chart items are rendered. The callback may customize the item or add new ones using the chart engine's properties and methods. This enables chart items (such as data points) to be formatted conditionally.
The function takes three parameters:
The chart's IRenderEngine responsible for rendering elements on the chart
A HitTestInfo parameter that describes the element being rendered
A function that provides the default rendering for the item. In most cases the chart's defaultRenderer method is used.
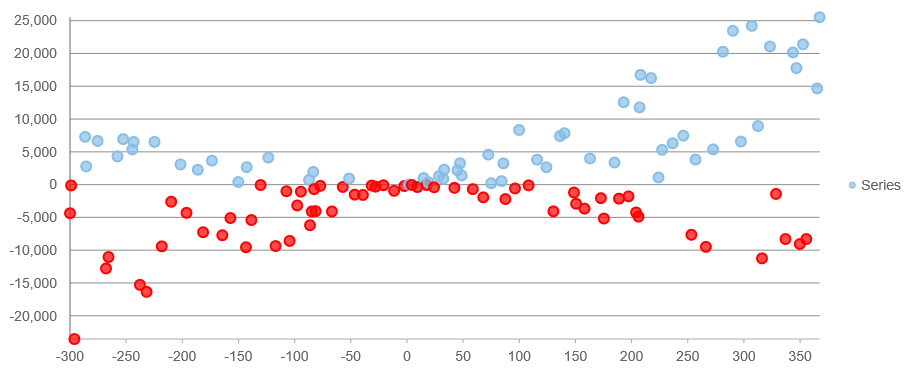
Conditional Formatting Example
The following itemFormatter example applies a different fill color for all data points less than 0.
import * as wjChart from '@mescius/wijmo.chart';

// create the chart
let myChart = new wjChart.FlexChart('#myChart', {
    itemFormatter: (engine, hitTestInfo, defaultRenderer) => {
        var ht = hitTestInfo;
        if (ht.y < 0) {
            engine.stroke = 'red';
            engine.fill = 'rgba(255,0,0,0.7)';
        }
        defaultRenderer();
    }
});
Custom Drawing Example
The itemFormatter can be used for more than just modifying the appearance of existing chart elements. The render engine can be called to draw additional, custom elements on the chart.
This example compares the previous data point to the current one and draws a line to indicate an upward or downward trend.
itemFormatter: function (engine, hitTestInfo, defaultRenderer) {
  var ht = hitTestInfo,
      binding = 'downloads';

  // check that this is the right series/element
  if (ht.series.binding == binding && ht.pointIndex > 0 &&
      ht.chartElement == wijmo.chart.ChartElement.SeriesSymbol) {

    // get current and previous values
    var chart = ht.series.chart,
        items = chart.collectionView.items,
        valNow = items[ht.pointIndex][binding],
        valPrev = items[ht.pointIndex - 1][binding];

    // add line if value is increasing
    if (valNow > valPrev) {
      var pt1 = chart.dataToPoint(ht.pointIndex, valNow),
          pt2 = chart.dataToPoint(ht.pointIndex - 1, valPrev);
      engine.drawLine(pt1.x, pt1.y, pt2.x, pt2.y, null, {
        stroke: 'gold',
        strokeWidth: 6
      });
    }
  }

  // render element as usual
  defaultRenderer();
}