Given below is the list of 2D charts that falls under the Bar Chart category.
Bar Chart
In a Bar Chart, values are represented by the height of the bar shaped marker as measured by the y-axis. Category labels are displayed on the x-axis. Use a bar chart to compare values of items across categories.
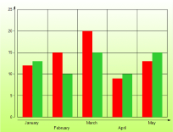
Bar Chart
|
Chart Information |
|
|---|---|
| ChartType | Bar2D |
| Number of Y values per data point | 1 |
| Number of series | 1 or more |
| Marker support | Series or Data Point |
| Custom Properties | The Gap property gets or sets the space between the bars of each X axis value. |
Below is an example of how to set the custom chart properties at run time for a bar chart.
| Visual Basic |
Copy Code
|
|---|---|
| Me.ChartControl1.Series(0).Properties("Gap") = 50.0F | |
| C# |
Copy Code
|
|---|---|
| this.ChartControl1.Series[0].Properties["Gap"] = 50f; | |
Gantt Chart
The Gantt chart is a project management tool used to chart the progress of individual project tasks. The chart compares project task completion to the task schedule.
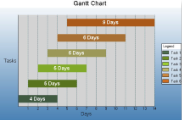
Gantt Chart
|
Chart Information |
|
|---|---|
| ChartType | Bar2D |
| Number of Y values per data point | 2 |
| Number of Series | 1 or more |
| Marker Support | Series or Data Point |
| Custom Properties | The Gap property gets or sets the space between the bars of each X axis value. |
Below is an example of how to set the custom chart properties at run time for a Gantt chart.
| Visual Basic |
Copy Code
|
|---|---|
| Me.ChartControl1.Series(0).Properties("Gap") = 50.0F | |
| C# |
Copy Code
|
|---|---|
| this.ChartControl1.Series[0].Properties["Gap"] = 50f; | |
Horizontal Bar Chart
In a Horizontal Bar Chart, both the axes are swapped and therefore the bars appears horizontally. Although, values are represented by the height of the bar shaped marker as measured by the y-axis and the Category labels are displayed on the x-axis. Use a horizontal bar chart to compare values of items across categories.
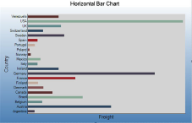
Horizontal Bar Chart
|
|
|
|---|---|
| ChartType | Bar2D |
| Number of Y values per data point | 1 |
| Number of Series | 1 or more |
| Marker Support | Series or Data Point |
| Custom Properties | The Gap property gets or sets the space between the bars of each X axis value. |
Below is an example of how to set the custom chart properties at run time for a horizontal bar chart.
| Visual Basic |
Copy Code
|
|---|---|
| Me.ChartControl1.Series(0).Properties("Gap") = 65.0F | |
| C# |
Copy Code
|
|---|---|
| this.ChartControl1.Series[0].Properties["Gap"] = 65f; | |
Stacked Bar Chart
A stacked bar chart is a bar chart with two or more data series stacked one on top of the other. Use this chart to show how each value contributes to a total.
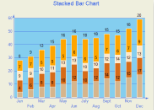
Stacked Bar Chart
|
|
|
|---|---|
| ChartType | Bar2D |
| Number of Y values per data point | 1 |
| Number of Series | 1 or more |
| Marker Support | Series or Data Point |
| Custom Properties | The Gap property gets or sets the space between the bars of each X axis value. |
Below is an example of how to set the custom chart properties at run time for a StackedBar chart.
| Visual Basic |
Copy Code
|
|---|---|
| Me.ChartControl1.Series(0).Properties("Gap") = 100.0F | |
| C# |
Copy Code
|
|---|---|
| this.ChartControl1.Series[0].Properties["Gap"] = 100f; | |
Stacked Bar Chart 100%
A StackedBAR110Pct chart is a bar chart with two or more data series stacked one on top of the other to sum up to 100%. Use this chart to show how each value contributes to a total with the relative size of each series representing its contribution to the total.
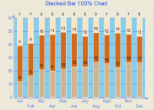
Stacked Bar Chart 100%
|
|
|
|---|---|
| ChartType | Bar2D |
| Number of Y values per data point | 1 |
| Number of Series | 1 or more |
| Marker Support | Series or Data Point |
| Custom Properties | The Gap property gets or sets the space between the bars of each X axis value |
Below is an example of how to set the custom chart properties at run time for a StackedBAR110Pct chart.
| Visual Basic |
Copy Code
|
|---|---|
| Me.ChartControl1.Series(0).Properties("Gap") = 100.0F | |
| C# |
Copy Code
|
|---|---|
| this.ChartControl1.Series[0].Properties["Gap"] = 100f; | |