Given below is the list of 2D charts that fall under the Line Chart category.
Bezier Chart
Use a Bezier or spline chart to compare trends over a period of time or across categories. It is a line chart that plots curves through the data points in a series.
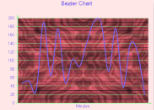
Bezier Chart
|
|
|
|---|---|
| ChartType | Line2D |
| Number of Y values per data point | 1 |
| Number of Series | 1 or more |
| Marker Support | Series or Data Point |
| Custom Properties | The Line property gets or sets the line element. Used to set color, thickness and shape of a line. The Tension property gets or sets the tension of the curved lines. |
Bezier XY Chart
A Bezier XY chart connects DataPoints on X and Y with curved lines.
|
|
||
|---|---|---|
|
ChartType |
Line2D | |
|
Number of Y values per data point |
1 | |
|
Number of Series |
1 or more | |
|
Marker Support |
Series or Data Point | |
|
Custom Properties |
The Line property gets or sets the line element. Used to set color, thickness and shape of a line. The Tension property gets or sets the tension of the curved lines. |
|
Line Chart
Use a 2D line chart to compare trends over a period of time or in certain categories in a 2D format.
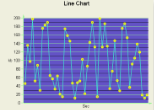
2D Line Chart
|
|
|
|---|---|
| ChartType | Line2D |
| Number of Y values per data point | 1 |
| Number of Series | 1 or more |
| Marker Support | Series or Data Point |
| Custom Properties | The Line property gets or sets the line element. Used to set color, thickness and shape of a line. The LineJoin property sets the type of join to draw when two lines connect. |
Line XY Chart
A line XY chart plots points on the X and Y axes as one series and uses a line to connect points to each other.
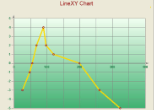
Line XY Chart
|
|
||
|---|---|---|
|
ChartType |
Line2D |
|
|
Number of Y values per data point |
1 |
|
|
Number of Series |
1 or more |
|
|
Marker Support |
Series or Data Point |
|
|
Custom Properties |
The Line property gets or sets line elements. Used for setting color, thickness and shape of a line. The LineJoin property gets or sets the type of join to draw when two lines connect. |
|