2D Pie/Doughnut Charts
In This Topic
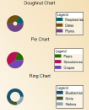
Given below is the list of 2D charts that fall under the Pie/Doughnut Chart category.
Doughnut Chart
A doughnut chart shows how the percentage of each data item contributes to the total.
Doughnut Chart
In order to show each section of the pie in a different color, set the Background property for each data point.
|
|
|
|---|---|
| ChartType | Pie/Doughnut 2D |
| Number of Y values per data point | 1 |
| Number of Series | 1 or more |
| Marker Support | Series or Data Point |
| Custom Properties | The Clockwise property gets or sets a value indicating whether to display the data in clockwise order. The ExplodeFactor property gets or sets the amount of separation between data point values. The HoleSize property gets or sets the inner radius of the chart. The OutsideLabels property gets or sets a value indicating whether the data point labels appear outside the chart. The StartAngle property gets or sets the horizontal start angle for the series. |
Below is an example of how to set custom chart properties at run time for a doughnut chart.
| Visual Basic |
Copy Code
|
|---|---|
| Me.ChartControl1.Series(0).Properties("ExplodeFactor") = 0.0F Me.ChartControl1.Series(0).Properties("HoleSize") = 0.25F Me.ChartControl1.Series(0).Properties("OutsideLabels") = False Me.ChartControl1.Series(0).Properties("Radius") = 2.0F Me.ChartControl1.Series(0).Properties("StartAngle") = 0.0F |
|
| C# |
Copy Code
|
|---|---|
| this.ChartControl1.Series[0].Properties["ExplodeFactor"] = 0f; this.ChartControl1.Series[0].Properties["HoleSize"] = 0.25f; this.ChartControl1.Series[0].Properties["OutsideLabels"] = false; this.ChartControl1.Series[0].Properties["Radius"] = 2.0f; this.ChartControl1.Series[0].Properties["StartAngle"] = 0f; |
|
Funnel Chart
A funnel chart shows how the percentage of each data item contributes as a whole.
|
Chart Information |
||
|---|---|---|
| ChartType | Pie/Doughnut 2D | |
| Number of Y values per data points | 1 | |
| Number of Series | 1 or more | |
| Marker Support | Series or Data Point | |
| Custom Properties | The CalloutLine property gets or sets the style for a line connecting the marker label to its corresponding funnel section. The default value is a black one-point line. The FunnelStyle property gets or sets the Y value for the series points to the width or height of the funnel. The default value is YIsHeight. The MinPointHeight property gets or sets the minimum height allowed for a data point in the funnel chart. The height is measured in relative coordinates. The NeckHeight property gets or sets the neck height for the funnel chart. This property can only be used with the FunnelStyle property set to YIsHeight. The default value is 5. The NeckWidth property gets or sets the neck width for the funnel chart. This property can only be used with the FunnelStyle property set to YIsHeight. The default value is 5. The OutsideLabels property gets or sets a value indicating whether the labels are placed outside of the funnel chart. The default value is True. The OutsideLabelsPlacement property gets or sets a value indicating whether the data point labels appear on the left or right side of the funnel. This property can only be used with the OutsideLabels property set to True. The PointGapPct property gets or sets the amount of space between the data points of the funnel chart. The PointGapPct is measured in relative coordinates. The default value is 0, and valid values range from 0 to 100. |
|
Pyramid Chart
A Pyramid chart shows how the percentage of each data item contributes as a whole.
|
Chart Information |
|
|---|---|
| ChartType | Pie/Doughnut 2D |
| Number of Y values per data point | 1 |
| Number of Series | 1 or more |
| Marker Support | Series or Data Points |
| Custom Properties | The CalloutLine property gets or sets the style for a line connecting the marker label to its corresponding pyramid section. The default value is a black one-point line. The MinPointHeight property gets or sets the minimum height allowed for a data point in the pyramid chart. The height is measured in relative coordinates. The OutsideLabels property gets or sets a value indicating whether the labels are placed outside of the pyramid chart. The default value is True. The OutsideLabelsPlacement property gets or sets a value indicating whether the data point labels appear on the left or right side of the pyramid. This property can only be used with the OutsideLabels property set to True. The PointGapPct property gets or sets the amount of space between the data points of the pyramid chart. The PointGapPct is measured in relative coordinates. The default value is 0, and valid values range from 0 to 100. |
See Also