Given below is the list of 2D charts that fall under the Point/Bubble Chart category.
Bubble Chart
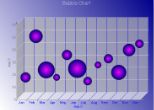
The Bubble chart is an XY chart in which bubbles represent data points. The first Y value is used to plot the bubble along the Y axis, and the second Y value is used to set the size of the bubble. The bubble shape can be changed using the series Shape property.
Bubble Chart
|
|
|
|---|---|
| ChartType | Point/Bubble2D |
| Number of Y values per data point | 2 |
| Number of Series | 1 or more |
| Marker Support | Series or Data Point. Marker labels use the second Y value as the default value. |
| Custom Properties | The MaxSizeFactor property gets or sets the maximum size of the bubble radius. Values must be less than or equal to 1. Default is .25. The MaxValue property gets or sets the bubble size that is used as the maximum. The MinValue property gets or sets the bubble size that is used as the minimum. The Shape property gets or sets the shape of the bubbles. Uses or returns a valid MarkerStyle enumeration value. |
Below is an example of setting the custom chart properties at run time for a bubble chart as shown in the image above.
To write code in Visual Basic.NET
| Visual Basic |
Copy Code
|
|---|---|
Me.ChartControl1.Series(0).Properties("MaxSizeFactor") = 0.25F
Me.ChartControl1.Series(0).Properties("MaxValue") = 55.0R
Me.ChartControl1.Series(0).Properties("MinValue") = 5.0R
Me.ChartControl1.Series(0).Properties("Shape") = GrapeCity.ActiveReports.Chart.MarkerStyle.Circle
|
|
To write code in C#
| C# |
Copy Code
|
|---|---|
this.ChartControl1.Series[0].Properties["MaxSizeFactor"] = .25f; this.ChartControl1.Series[0].Properties["MaxValue"] = 55D; this.ChartControl1.Series[0].Properties["MinValue"] = 5D; this.ChartControl1.Series[0].Properties["Shape"] = GrapeCity.ActiveReports.Chart.MarkerStyle.Circle; |
|
Bubble XY Chart
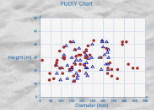
The Bubble XY chart is an XY chart in which bubbles represent data points. The BubbleXY uses a numerical X axis and plots the x values and first set of Y values on the chart. The second Y value is used to set the size of the bubble.
|
|
||
|---|---|---|
|
ChartType |
Point/Bubble2D | |
|
|
2 | |
|
Number of Series |
1 or more | |
|
Marker Support |
Series or Data Point. Marker labels use the second Y value as the default value. | |
|
Custom Properties |
The MaxSizeFactor gets or sets the maximum size of the bubble radius. Values must be less than or equal to 1. Default is .25. |
|
Below is an example of setting the custom chart properties at run time for a bubble XY chart as shown in the image above.
To write code in Visual Basic.NET
| Visual Basic |
Copy Code
|
|---|---|
Me.ChartControl1.Series(0).Properties("MaxSizeFactor") = 0.25F
Me.ChartControl1.Series(0).Properties("MaxValue") = 50.0R
Me.ChartControl1.Series(0).Properties("MinValue") = 0.0R
Me.ChartControl1.Series(0).Properties("Shape") = GrapeCity.ActiveReports.Chart.MarkerStyle.InvTriangle
|
|
To write code in C#
| C# |
Copy Code
|
|---|---|
this.ChartControl1.Series[0].Properties["MaxSizeFactor"] = .25f; this.ChartControl1.Series[0].Properties["MinValue"] = 0D; this.ChartControl1.Series[0].Properties["MaxValue"] = 50D; this.ChartControl1.Series[0].Properties["Shape"] = GrapeCity.ActiveReports.Chart.MarkerStyle.InvTriangle; |
|
Plot XY Chart
A plot XY chart shows the relationships between numeric values in two or more series sets of XY values.
Plot XY Chart
|
|
||
|---|---|---|
|
ChartType |
Point/Bubble2D | |
|
Number of Y values per data point |
1 | |
|
Number of Series |
1 or more | |
|
Marker Support |
Series or Data Point | |
|
Custom Properties |
None | |
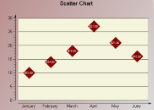
Scatter Chart
Use a scatter chart to compare values across categories.
Scatter Chart
|
|
|
|---|---|
| ChartType | Point/Bubble2D |
| Number of Y values per data point | 1 |
| Number of Series | 1 or more |
| Marker Support | Series or Data Point |
| Custom Properties | None |