3D Area Charts
In This Topic
Given below is the list of 3D charts that fall under the Area Chart category:
Area Chart
Use a 3D area chart to compare trends in two or more data series over a period of time or in specific categories, so that data can be viewed side by side.
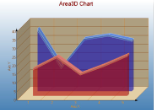
3D Area Chart
Note: To view a chart in 3D, in the ChartAreas property open the ChartArea Collection Editor and set the ProjectionType property to Orthogonal.
|
|
|
|---|---|
| ChartType | Area3D |
| Number of Y values per data point | 1 |
| Number of Series | 1 or more |
| Marker Support | Series or Data Point |
| Custom Properties | The LineBackdrop property gets or sets the backdrop information for the 3D line. The Thickness property gets or sets the thickness of the 3D line. The Width property gets or sets the width of the 3D line. |
Below is an example of how to set the custom chart properties at run time for a 3D area chart as shown for the first series in the image above.
| Visual Basic |
Copy Code
|
|---|---|
Me.ChartControl1.Series(0).Properties("LineBackdrop") = New GrapeCity.ActiveReports.Chart.Graphics.Backdrop(Color.Red, CType(150, Byte))
Me.ChartControl1.Series(0).Properties("Thickness") = 5.0F
Me.ChartControl1.Series(0).Properties("Width") = 30.0F
|
|
| C# |
Copy Code
|
|---|---|
this.ChartControl1.Series[0].Properties["LineBackdrop"] = new GrapeCity.ActiveReports.Chart.Graphics.Backdrop(System.Drawing.Color.Red, ((System.Byte)(150))); this.ChartControl1.Series[0].Properties["Thickness"] = 5f; this.ChartControl1.Series[0].Properties["Width"] = 30f; |
|
Stacked Area Chart
3D stacked area chart displays stacked area chart in 3D.
|
Chart Information |
|
|---|---|
| ChartType | Area3D |
| Number of Y values per data point | 1 |
| Number of Series | 1 or more |
| Marker Support | Series or Data Point |
| Custom Properties | The Width property gets or sets the width of the 3D stacked area. |
Stacked Area 100%
3D stacked area chart (100%) displays stacked area chart in 3D (100%).
|
|
|
|---|---|
| ChartType | Area3D |
| Number of Y values per data point | 1 |
| Number of Series | 1 or more |
| Marker Support | 3 |
| Custom Properties | The Width property gets or sets the width of the 3D stacked area. |
See Also