Given below is the list of 3D charts that fall under the Pie/Doughnut Chart category.
Doughnut Chart
A 3D doughnut chart shows how the percentage of each data item contributes to a total percentage, allowing the data to be viewed in a 3D format.
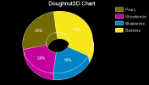
3D Doughnut Chart
|
Chart Information |
|
|---|---|
| ChartType | Pie/Doughnut 3D |
| Number of Y values per data point | 1 |
| Number of Series | 1 or more |
| Marker Support | Series or Data Point |
| Custom Properties | The Clockwise property gets or sets a value indicating whether to display the data in clockwise order. The ExplodeFactor property gets or sets the amount of separation between data point values. The value must be less than or equal to 1. To explode one section of the doughnut chart, set ExplodeFactor to the data point instead of the series. The HoleSize property gets or sets the inner radius of the chart. If set to 0, the chart looks like a pie chart. The value must be less than or equal to 1. The OutsideLabels property gets or sets a value indicating whether the data point labels appear outside the chart. The Radius property gets or sets the size of the doughnut within the chart area. The StartAngle property gets or sets the horizontal start angle for the series data points. |
Below is an example of how to set the custom chart properties at run time for a 3D doughnut chart as shown in the image above.
To write the code in Visual Basic.NET
| Visual Basic |
Copy Code
|
|---|---|
Me.ChartControl1.Series(0).Properties("ExplodeFactor") = 0.0F
Me.ChartControl1.Series(0).Properties("HoleSize") = 0.33F
Me.ChartControl1.Series(0).Properties("OutsideLabels") = False
Me.ChartControl1.Series(0).Properties("Radius") = 2.0F
Me.ChartControl1.Series(0).Properties("StartAngle") = 50.0F
|
|
To write the code in C#
| C# |
Copy Code
|
|---|---|
this.chartControl1.Series[0].Properties["ExplodeFactor"] = 0f; |
|
Funnel Chart
A 3D funnel chart shows how the percentage of each data item contributes to the whole, allowing the data to be viewed in a 3D format.
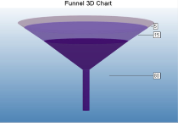
3D Funnel Chart
|
|
||
|---|---|---|
| ChartType | Pie/Doughnut 3D | |
| Number of Y values per data points | 1 | |
| Number of Series | 1 or more | |
| Marker Support | Series or Data Point | |
|
Custom Properties |
The BaseStyle property gets or sets a circular or square base drawing style for the 3D funnel chart. |
|
Below is an example of how to set the custom chart properties at run time for a 3D funnel chart.
To write the code in Visual Basic.NET
| Visual Basic |
Copy Code
|
|---|---|
Imports GrapeCity.ActiveReports.Chart Imports GrapeCity.ActiveReports.Chart.Graphics |
|
| Visual Basic |
Copy Code
|
|---|---|
With Me.ChartControl1.Series(0)
    .Properties("BaseStyle") = BaseStyle.SquareBase
    .Properties("CalloutLine") = New Line(Color.Black, 2, LineStyle.Dot)
    .Properties("FunnelStyle") = FunnelStyle.YIsWidth
    .Properties("MinPointHeight") = 10.0F
    .Properties("NeckWidth") = 20.0F
    .Properties("NeckHeight") = 5.0F
    .Properties("OutsideLabels") = True
    .Properties("OutsideLabelsPlacement") = LabelsPlacement.Right
    .Properties("PointGapPct") = 3.0F
    .Properties("RotationAngle") = 3.0F
End With
|
|
To write the code in C#
| C# |
Copy Code
|
|---|---|
using GrapeCity.ActiveReports.Chart; using GrapeCity.ActiveReports.Chart.Graphics; |
|
| C# |
Copy Code
|
|---|---|
this.ChartControl1.Series[0].Properties["BaseStyle"] = BaseStyle.SquareBase; this.ChartControl1.Series[0].Properties["CalloutLine"] = new Line(Color.Black, 2, LineStyle.Dot); this.ChartControl1.Series[0].Properties["FunnelStyle"] = FunnelStyle.YIsWidth; this.ChartControl1.Series[0].Properties["MinPointHeight"] = 10f; this.ChartControl1.Series[0].Properties["NeckWidth"] = 20f; this.ChartControl1.Series[0].Properties["NeckHeight"] = 5f; this.ChartControl1.Series[0].Properties["OutsideLabels"] = true; this.ChartControl1.Series[0].Properties["OutsideLabelsPlacement"] = LabelsPlacement.Right; this.ChartControl1.Series[0].Properties["PointGapPct"] = 3f; this.ChartControl1.Series[0].Properties["RotationAngle"] = 3f; |
|
Pyramid Chart
A 3D Pyramid chart shows how the percentage of each data item contributes to the whole, allowing the data to be viewed in a 3D format.
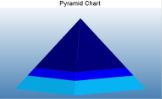
3D Pyramid Chart
|
|
|
|---|---|
| ChartType | Pie/Doughnut 3D |
| Number of Y values per data point | 1 |
| Number of Series | 1 or more |
| Marker Support | Series or Data Points |
| Custom Properties |
The BaseStyle property gets or sets a circular or square base drawing style for the 3D pyramid chart. |
Below is an example of how to set the custom chart properties at run time for a Pyramid chart.
To write the code in Visual Basic.NET
| Visual Basic |
Copy Code
|
|---|---|
Imports GrapeCity.ActiveReports.Chart Imports GrapeCity.ActiveReports.Chart.Graphics |
|
| Visual Basic |
Copy Code
|
|---|---|
With Me.ChartControl1.Series(0) |
|
To write the code in C#
| C# |
Copy Code
|
|---|---|
using GrapeCity.ActiveReports.Chart; using GrapeCity.ActiveReports.Chart.Graphics; |
|
| C# |
Copy Code
|
|---|---|
this.ChartControl1.Series[0].Properties["BaseStyle"] = BaseStyle.SquareBase; this.ChartControl1.Series[0].Properties["MinPointHeight"] = 10f; this.ChartControl1.Series[0].Properties["OutsideLabels"] = true; this.ChartControl1.Series[0].Properties["OutsideLabelsPlacement"] = LabelsPlacement.Right; this.ChartControl1.Series[0].Properties["PointGapPct"] = 3f; this.ChartControl1.Series[0].Properties["RotationAngle"] = 3f; |
|
Pie Chart
This type of chart displays the contribution of each value to a total.
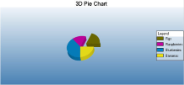
3D Pie Chart
|
Chart Information |
|
|---|---|
| ChartType | Pie/Doughnut 3D |
| Number of Y values per data point | 1 |
| Number of Series | 1 or more |
| Marker Support | Series or Data Point |
| Custom Properties | |
Ring Chart
This chart type uses rings (inner and outer) to represent data.
|
Chart Information |
|
|---|---|
| ChartType | Pie/Doughnut 3D |
| Number of Y values per data point | 1 |
| Number of Series | 1 or more |
| Marker Support | Series or Data Point |
| Custom Properties | |