You can use Labels in Chart markers or legends.
By default, marker labels display Y value of data points, whereas legend labels display series name or data name.
Setting Strings
You can change a string (format string) displayed in a marker or legend label.
To change a string in a marker label
- Display the Series collection editor of properties window.
- Select the series that sets marker. (By default the first series (Series1) gets selected.
- Expand the Properties property.
- Expand the Marker property.
- Expand the Label property.
- Set the string to display in the Format property.
To change a string in a legend label
- Display the Series collection editor of properties window.
- Set the string you want to set in legend label using the LegendText property.
When the LegendItemMode property of Series is set to Series, series are displayed in legend. Data point will be displayed when set to Point. By default, in each graph the common setting will get displayed. For example, in case of bar chart it is series and in case of pie chart it is data point that gets displayed in legends.
Symbols
It is possible to easily display constant strings by simply performing the above mentioned settings. To display data, you need to embed the section (placeholder) that displays the value within format string at run time.
A placeholder is a particular symbol enclosed within brackets {}.
The following symbols can be used. The sections enclosed within {} are changed by values.
Value
Data Value(Y value)
Pct
Percentage within series
PPct
Percentage having 100% as sum of multiple series for data points.
Name
X value of data
Index
Index of data point
Total
Total number of series
PTotal
Total number of multiple series for data points
When displaying numeric value, it is possible to set format specifying string similar to System.String.Format method used when displaying numeric values. For example, when format string is {Value}, numeric value is displayed in default format but when ":" (colon) format specifying string is added after Value, it is possible to insert comma or specify decimal place digits.
For example, the format string for "inserting comma in numeric value and displaying 2 digits after decimal place" would be as follows.
{Value:#,##0.00}
Please refer to the technical information posted on Microsoft site for details on format specifying string after continued numeric value after comma.
- [Format Function]
- [User defined numeric value format (Format function)]
Sample Image
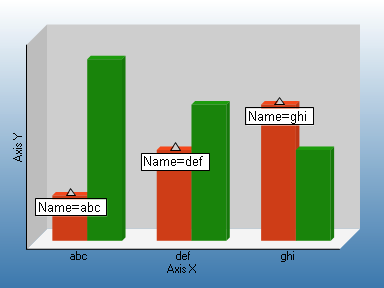
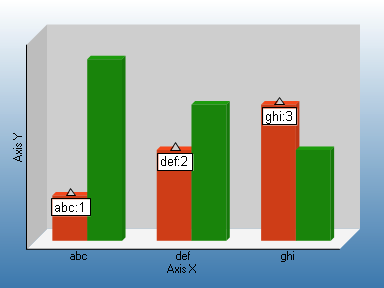
The following image displays a bar chart with the following values.
| X Value | abc | def | ghi |
| Y value of series 1(Red) | 1 | 2 | 3 |
| Y value of series 2(green) | 4 | 3 | 2 |
String displayed below the image is a string set in Label.Format property of marker.


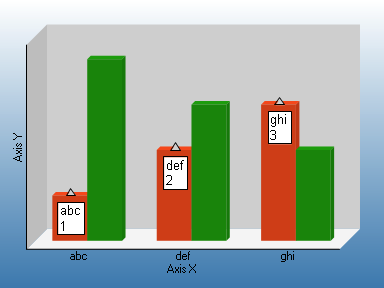
In case you wish to add a line break in between, as it is not possible to add a line break from Series collection editor, the following format string needs to be set at run time.
To write code in Visual Basic.NET
| Visual Basic |
Copy Code
|
|---|---|
Private Sub rptLabelSymbol4_ReportStart(ByVal sender As System.Object, ByVal e As System.EventArgs) Handles MyBase.ReportStart

Dim m As GrapeCity.ActiveReports.Chart.Marker
m = CType(Me.ChartControl1.Series(0).Properties("Marker"), GrapeCity.ActiveReports.Chart.Marker)
m.Label.Format = "{Name}" & vbCrLf & "{Value}"
End Sub
|
|
To write code in C#
| C# |
Copy Code
|
|---|---|
private void NewActiveReport1_ReportStart(object sender, EventArgs e)
{
GrapeCity.ActiveReports.Chart.Marker m;
m = (GrapeCity.ActiveReports.Chart.Marker)
this.ChartControl1.Series[0].Properties["Marker"];
m.Label.Format = "{Name}\n{Value}";
}
|
|
Specific symbols
The specific symbols that are used according to the chart type.
Bubble Charts
Value
Y2 value
Value0
Y value
Value1
Y2value
Bubble XY Chart
Value0
X value
Value1
Y value
Value2
Y2 value
Candle or Hilo Chart
For a Candle chart or HiLo chart, symbols are not enabled for legend or marker labels.