
- Getting Started
-
Topics
- Wijmo
-
Chart
- Basic
-
Advanced
- Animation
- Annotations
- Conditional Formatting
- Data Labels
- Export
- Grouping and Drilldown
- Hit-Testing
- Interpolating Nulls
- Legend and Titles
- Line Markers
- Plot Areas
- Range Selectors
- Selection
- Sorting & Filtering
- Styling Series
- Toggle Series Visibility
- Tooltips
- Zooming
- Financial
- SpecialCharts
- Axes
- Analytics
- Map
- Cloud
- Gauge
- Grid
- OLAP
- Input
- Nav
- Viewer
Waterfall Charts
The wijmo.chart.analytics module contains classes that extend the Series class to provide extra information about the data including: trend lines, moving averages, error bars, box and waterfall plots, and function plots.
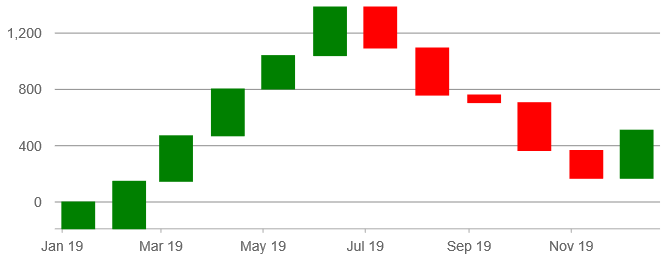
Waterfall charts help in understanding the cumulative effect of sequentially introduced positive or negative values. It demonstrates how the starting position either increases or decreases through a series of changes. The Waterfall chart is also known as a "flying bricks" chart or Mario chart due to the apparent suspension of columns in mid-air.
To create a Waterfall chart, follow these steps:
- Create a Waterfall series object,
- Configure the Waterfall series by setting its name and binding properties.
- Set the styles for the various waterfall elements such as start, total, falling, and rising.
Example:
import * as chart from '@mescius/wijmo.chart';
import * as analytics from '@mescius/wijmo.chart.analytics';

// create Waterfall series for 'sales' and add it to the chart
var sales = new analytics.Waterfall();
sales.name = 'Sales';
sales.binding = 'sales';
sales.styles = {
    start: { fill: 'blue', stroke: 'blue' },
    total: { fill: 'yellow', stroke: 'yellow' },
    falling: { fill: 'red', stroke: 'red' },
    rising: { fill: 'green', stroke: 'green' }
};
myChart.series.push(sales);
Additional Waterfall Options
In addition to customizing the style, the Waterfall class includes several other options you can configure.
- connectingLines: Determines whether to show connector lines.
- intermediateTotalLabels: Contains labels for the intermediate total bars. This should be an array or string.
- intermediateTotalPositions: Contains the index for positions of the intermediate total bars.
- relativeData: Determines whether the given data represents absolute or relative values (differences).
- showIntermediateTotal: Determines whether to show intermediate total bars.
- showTotal: Determines whether to show the total bar at the end of the chart.
- start: The value of the start bar. If start is null, the start bar will not be shown.
- startLabel: The label of the start bar.
- totalLabel: The label of the total bar.
Waterfall Styles
The following styles are supported:
- start: Specifies the style of the start column.
- total: Specifies the style of the total column.
- intermediateTotal: Specifies the style of the intermediate total column.
- falling: Specifies the style of the falling columns.
- rising: Specifies the style of the rising columns.
- connectorLines: Specifies the style of the connectorLines.
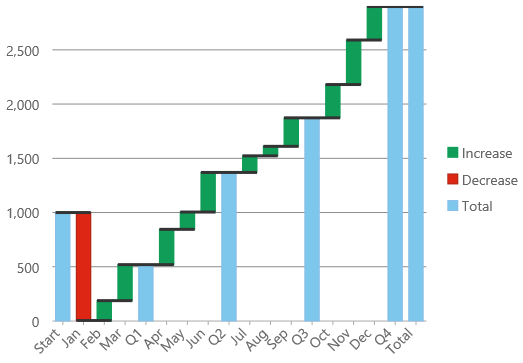
Complete Example:
import * as chart from '@mescius/wijmo.chart';
import * as analytics from '@mescius/wijmo.chart.analytics';

// create Waterfall series with all options
var waterfall = new analytics.Waterfall({
    relativeData: true,
    connectorLines: true,
    showTotal: true,
    start: 1000,
    showIntermediateTotal: true,
    intermediateTotalPositions: [3, 6, 9, 12],
    intermediateTotalLabels: ['Q1', 'Q2', 'Q3', 'Q4'],
    name: 'Increase,Decrease,Total',
    styles: {
        connectorLines: {
            stroke: '#333',
            strokeWidth: 3
        },
        start: {
            fill: '#7dc7ed'
        },
        falling: {
            fill: '#dd2714',
            stroke: '#a52714'
        },
        rising: {
            fill: '#0f9d58',
            stroke: '#0f9d58'
        },
        intermediateTotal: {
            fill: '#7dc7ed'
        },
        total: {
            fill: '#7dc7ed'
        }
    }
});
myChart.series.push(waterfall);
Display Options for Waterfall Series
The Waterfall series is supported like any series in FlexChart. You can choose whether or not the waterfall series displays an entry in the legend by setting the visibility property to one of the following:
- Visible: The series is visible on the plot and in the legend.
- Plot: The series is visible only on the plot.
- Legend: The series is visible only in the legend.
- Hidden: The series is hidden.
The legend text is set using the name property of the waterfall series.