- Getting Started
-
Topics
- Wijmo
-
Chart
- Basic
-
Advanced
- Animation
- Annotations
- Conditional Formatting
- Data Labels
- Export
- Grouping and Drilldown
- Hit-Testing
- Interpolating Nulls
- Legend and Titles
- Line Markers
- Plot Areas
- Range Selectors
- Selection
- Sorting & Filtering
- Styling Series
- Toggle Series Visibility
- Tooltips
- Zooming
- Financial
- SpecialCharts
- Axes
- Analytics
- Map
- Cloud
- Gauge
- Grid
- OLAP
- Input
- Nav
- Viewer
Axis Labels in FlexChart
Use the axisX and axisY properties to configure the axis label rotation, format, and alignment.
Rotating the Axis Labels
The labels along the X axis are automatically rotated to avoid collisions. If you want to prevent that, set the labelAngle property to a number 0-360 (degrees). Use negative values to rotate the labels counter-clockwise.
// rotate axis X labels by 45 degrees clockwise
myChart.axisX.labelAngle = 45;
Format the Axis Labels
Use the format property to specify the format string applied to axis labels. The format string is based on the Globalization features found in the core guide (see the Globalize class).
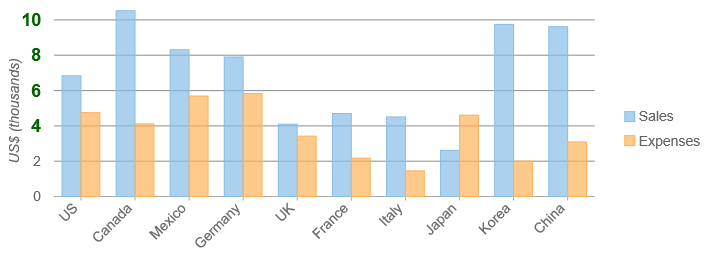
In this sample, we set the format of the Y axis labels to 'n0,', which scales the values to show thousands instead of the raw values. This is done by Wijmo's Globalize class, which takes the current culture into account.
import * as chart from '@mescius/wijmo.chart';

// create the chart with formatted Y axis
var myChart = new chart.FlexChart('#myChart', {
    axisY: {
        format: 'n0,',
        title: 'US$ (thousands)'
        }
  });
The format property also accepts date & time format strings.
myChart.axisX.format = 'MMM dd';
Label Alignment & Padding
By default, the labels are centered on the tick mark with 5 px padding between. Adjust the alignment and padding by setting the labelAlign and labelPadding properties.
myChart.axisX.labelAlign = 'left'; // left, right, center
myChart.axisX.labelPadding = 10;
myChart.axisY.labelAlign = 'top'; // top, bottom, center
myChart.axisY.labelPadding = 10;
Custom Axis Labels
The Axis class has an itemFormatter property that allows you to customize the content and appearance of specific labels along the axes.
If specified, the itemFormatter function takes two parameters:
- engine: The IRenderEngine object used for rendering the labels.
- label: An object that represents the label and has these properties:
- value: The value that the label represents.
- text: The text content of the label (usually the formatted value).
- pos: The position where the label will be rendered, in control coordinates.
- cls: A CSS class to be applied to the label element.
Example:
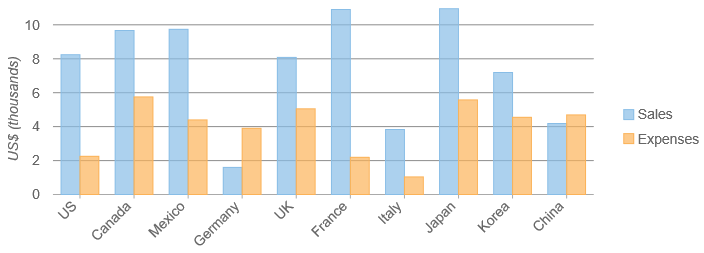
import * as chart from '@mescius/wijmo.chart';

// create the chart with axis itemFormatter
var myChart = new chart.FlexChart('#myChart', {
    axisY: {
        format: 'n0,',
        title: 'US$ (thousands)',
        itemFormatter: function(engine, label) {
            if (label.val >= 4000){
                label.cls = 'large-value';
                }
                return label;
                }
    }
  });