
Get Started With Tabular Reports
Introduction
A tabular report is the most straightforward way to visualize your data with ActiveReportsJS. The most basic tabular report is organized in a multicolumn, multirow fashion, with an ordered set of fields in columns and each data record displayed in a row. In addition, a tabular report can group, sort, and filter the data based on pre-defined conditions or user input. Examples of tabular reports are inventory lists, product catalogs, activity reports, and many others.
In this tutorial, we build the Product List report from the ground up, providing experience with the typical report designing process. By the end, you will be able to do the following:
Create a new report
Bind the report to the REST API with multiple endpoints
Create a table data region to display the subset of the data
Apply formatting to the table columns
Display the general report information in the table header
Group the data within the table
Use the Lookup function to display the data from multiple data sets
Display column headers and summary fields in the group header and the group footer, respectively
Filter the data within the table
Apply conditional formatting to the table rows
Add interactive sorting for the table columns
Upon completion of all tutorial steps, the final report will look like this: live demo.
Prerequisites
The following content assumes that you have the Standalone Report Designer running. Visit the tutorial for detailed information. A stable internet connection is also required to access the Demo Data Hub.
Creating a New Report
In the standalone report designer, click the File menu and select the Continuous Page Layout template for a newly created report. Click anywhere on the gray area around the report layout to load the report properties in the Properties panel. In the Margins section, set the Style property to Narrow to change the report page margins size.
Expand to watch creating a new report in action
Data Binding
Data Binding establishes a connection between a report and the data it displays. In this tutorial, we use the MESCIUS Demo REST API that replicates the well-known Northwind database. It contains the sales data for a fictitious company called Northwind Traders, which imports and exports specialty foods worldwide.
Adding Data Source
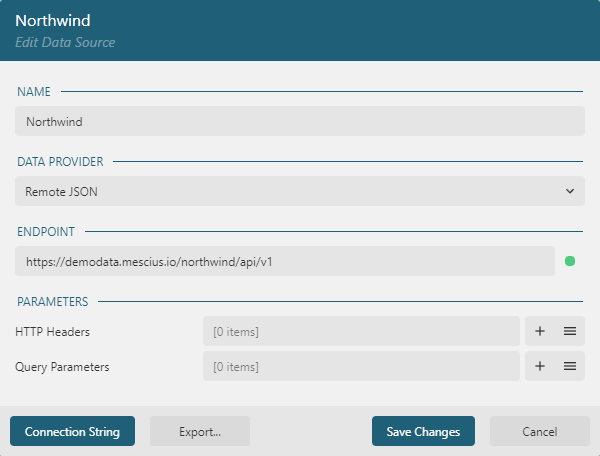
You can think of the Northwind REST API as the "database" that you can connect to using its root URL https://demodata.mescius.io/northwind/api/v1, and that has multiple "tables" which presented with endpoints such as /Products, /Customers, and /Orders. You can create a Report DataSource that establishes the connection to such a "database" using the following steps.
Open the Data panel of the property inspector and click the
Addbutton.In the Data Source editor dialog, type
Northwindin the NAME field andhttps://demodata.mescius.io/northwind/api/v1in the ENDPOINT field.Click the
Save Changesbutton
Adding Data Sets
Data Sets represent one or more endpoints of the Data Source. For the Product List report, we need to have access to the data from the /Products and /Categories endpoints of the Northwind Data Source that we added in the previous section. Use the following steps to add the Products data set:
Click the
+icon nearNorthwindin the Data panel.In the Data Set Editor dialog, type
Productsin the NAME field,/Productsin the Uri/Path field, and$.*in the Json Path field.Click the
Validatebutton.Ensure that the
DataBase Fieldssection displays[10 items]text.Click the
Save Changesbutton
Expand to watch adding the Products data set in action
Next, add the Categories data set with the same approach:
Click the
+icon nearNorthwindin the Data panel.In the Data Set Editor dialog, type
Categoriesin the NAME field,/Categoriesin the Uri/Path field, and$.*in the Json Path field.Click the
Validatebutton.Ensure that the
DataBase Fieldssection displays[3 items]text.Click the
Save Changesbutton
Adding Table Data Region
The simplest way to visualize the data in a tabular report is to use Table Data Region. There several ways to add a new table into the report. We will use the quick way for this tutorial:
Expand the "Products" data set in the Data panel using the chevron-down icon
Click the "Select fields" icon near the "Products" data set name
Select
productName,unitPrice,unitsInStock,unitsOnOrder, andreorderLevelfieldsDrag and Drop selected fields into a top left corner of a report layout
Expand to watch adding the Table Data Region in action
The newly created table has five columns, one per each selected field, the header row that displays the field names, and the detail row that shows the values of the fields. You can preview the report output and notice that detail rows display the selected field values for all the products from the data sets, and the table header repeats on each page and show field names.
Formatting Table Columns
Go back to the report design and click anywhere inside the table to display the columns and rows handlers and the group editor.
Click the first column's handler and set its width to 2.5in in the Properties panel. Similarly, set the second column's width to 1.1in and to 1.3in for the rest of the columns. Thus, the table width will be equal to 7.5in and fit the report's printable area defined by the report page size and margins.
Click the table cell that displays the {unitPrice} text and set its Format property to Currency in the properties panel.
Expand to watch setting the last column's width and the ```{unitPrice}``` formatting in action
You can preview the report output and notice that product names in the first column fit into a single line and the unit price displays as a currency due to column formatting.
Displaying the Report Title in the Table Header
The default table header row shows the column headers. We will replace them with the report title and add column headers later.
Go back to the report design and click anywhere inside the table to display the columns and rows handlers.
Click the first row handler and set its
Heightto0.6inin the Property inspector.Switch to the
TEXTBOXtab in the Property inspector. You can now modify the properties of all the table cells of the selected row.Click the green box on the right side of the
Valueproperty and selectReset. This action removes the default text of the table cells.Set the
Vertical AligntoMiddle,Text Colorto#3da7a8,Font Sizeto22ptin the Properties panel.Double click the top-left cell of the table and type
Product List
Expand to watch modifying the table header in action
You can preview the report output and notice that each page now displays the Product List report title.
Adding Table Grouping
There are multiple product categories in the Northwind database - Beverages, Seafood, Meat, etc. Each record on the Products dataset has the categoryId field. Thus, we can group the products by their category. There are two ways to add a grouping into the table data region. We use the quick way for this tutorial:
Go back to the report design and expand the "Products" data set in the Data panel using the chevron-down icon
Click anywhere inside the table to display the Group editor.
Drag and drop the
categoryIdfield to the Group Editor's<New Group>highlighted area.Select the newly appeared
Table1_categoryIditem in the group editorSwitch to the
Propertiestab of the Property InspectorSet the
Page Breakproperty of the grouping toBetweenso that each group starts on the new page
Expand to watch adding grouping in action
Notice that the table now has two additional rows - the group header and the group footer. The former displays the {categoryId} value in its first column, the latter is empty for now, but we will use it later for summary values.
You can preview the report output and notice that it produces eight pages. Each page represents the product category, prints its Id in the beginning, and follows with its products.
Displaying fields from multiple data sets
Displaying the category Id is not very informative, so let's display the category name instead. The Products data set does not contain the categoryName field, but the Categories data set does. We will use the Lookup function to resolve the category name by its Id:
Go back to the report design and click anywhere inside the table to display the columns and rows handlers.
Click the second row handler(group header) and set its
Heightto0.6inin the Property inspector.Switch to the
TEXTBOXtab in the Property inspector. You can now modify the properties of all the table cells of the selected row.Click the green box on the right side of the
Valueproperty and selectReset. This action removes the default text of the table cells.Set the
Font Sizeproperty to16pt,Font WeighttoBold, andVertical AligntoMiddle
Note: steps above are very similar to those we used for Displaying Report Title in the Table Header. You can check the animated guideline in that section.
Click the first table cell of the group header row. Press the
Ctrl(Windows) orCmd(Mac OS) key and click four following cells on the right side to apply multi-selection.Right-click the selection and choose the
Cells/Merge Cellsmenu. See merging cells in a table for more information.Double click the merged cell and type
{Lookup(categoryId, categoryId, categoryName, "Categories")}. This function takes the value of the first argument in the current scope - thecategoryIdof the current group - finds the row with the samecategoryIdvalue in theCategoriesdata set and returns the correspondingcategoryNamevalue.
Expand to watch setting merging cells and using the Lookup function in action.
You can preview the report output and notice that each page now displays the category name, and it visually differs from product rows.
Displaying column headers
Previously, we removed the default table header, and currently, the table does not display the column headers. Now, we will use the additional group header row for column headers.
Go back to the report design and click anywhere inside the table to display the columns and rows handlers.
Right-click the second row handler(group header) and select the
Row/Insert Row Belowin the context menu. The group header now has two rows.Click the newly added row handler and set its
Heightproperty to0.5inin the property inspectorSwitch to the
TEXTBOXtab in the Property inspector. You can now modify the properties of all the table cells of the selected row.Set the
Border Widthproperty to0.25ptExpand the
Border Styleeditor using the icon on its right side and set theBottom Border Styleproperty toSolidSet the
Border Colorproperty toGainsboroSet the
Text Colorproperty to#3da7a8, theFont WeighttoBold, and theVertical AligntoMiddleDouble click the first cell of the newly added row, type
Product NameDouble click the second cell of the newly added row, type
Unit Price, then click theRight Text Alignbutton on the toolbarDouble click the third cell of the newly added row, type
Units In Stock, then click theRight Text Alignbutton on the toolbarDouble click the 4th cell of the newly added row, type
Units On Order, then click theRight Text Alignbutton on the toolbarDouble click the 5th cell of the newly added row, type
Reorder Point, then click theRight Text Alignbutton on the toolbar
You can preview the report output and notice that each page now displays accurately aligned column headers.
Displaying field summaries
Table Data Region supports a wide variety of field summaries. The product list report will display totals for Units In Stock and Units On Order fields in the group footer.
Go back to the report design and click anywhere inside the table so that it displays the columns and rows handlers
Click the last row's handler and set its
Heightproperty to0.5inin the property inspectorSwitch to the
TEXTBOXtab in the Property inspector. You can now modify the properties of all the table cells of the selected rowSet the
Border Widthproperty to0.25ptExpand the
Border Styleeditor using the icon on its right side and set theTop Border Styleproperty toSolidSet the
Border Colorproperty toGainsboroSet the
Font Weightproperty toBold, and theVertical Alignproperty toMiddleDouble click the first cell of the group footer row, type
TotalDouble click the third cell of the newly added row, type
{Sum(unitsInStock)}, then click theRight Text Alignbutton on the toolbarDouble click the 4th cell of the newly added row, type
{Sum(unitsOnOrder)}, then click theRight Text Alignbutton on the toolbar
You can preview the report output and notice that each group now displays totals of units in stock and units on order in the footer.
Filter Table Data
Some products are marked discontinued and the Products dataset has the corresponding flag for each Product record in the Northwind database. We will filter out the discontinued products so that the table would not display them.
Go back to the report design and click anywhere inside the table so that it displays the root handler
Click the root handler to load the table's properties into the property inspector
Click the
+Add...link in the Filters EditorClick the
+Add...button and selectdiscontinuedin the popup menuClick the text area on the right side of the
=sign and typeFalse
Expand to watch adding filters in action
You can preview the report output and notice that some products do not appear anymore.
Adding conditional formatting to the data rows
In the Northwind database, product records have the reorderLevel field that indicates the number of product units in stock required to replenish that particular product. This last column of the table that we built so far displays the value of the reorderLevel for each product. We will now highlight the products that reached the reorder point with a background color that associates with warning
Go back to the report design and click anywhere inside the table so that it displays the columns and rows handlers
Click the fourth row's handler and set its
Heightproperty to0.4inin the property inspectorSwitch to the
TEXTBOXtab in the Property inspector. You can now modify the properties of all the table cells of the selected row.Set the
Background Colorproperty to{IIF(unitsInStock <= reorderLevel, "MistyRose", "Transparent")}- this expression is using the IIF function to conditionally apply the background color to all the table cells of the selected row.Set the
Vertical AligntoMiddle
You can preview the report output and notice that products that reached the reorder point are now highlighted with the MistyRose color.
Adding interactive sorting
Table Data Region supports two types of data sorting:
Design-time sorting - the report author, decides on how the data should be sorted
Interactive sorting - the report readers determine how to sort the data at preview time
We will add the interactive sorting for all but Reorder Point table columns that we built so far for the product list report.
Go back to the report design
Click the first cell of the third table row that displays the
Product Nametext, find theUser Sortsection in the Properties panel, and set theSort Expressionto{productName}using the selector on the right side of the editor.Similarly, set the
Sort Expressionto{unitPrice},{unitsInStock},{unitsOnOrder}for the second, third, and fourth cells of the third table row, respectively.
Expand to watch adding the interactive sort for the Product Name column
You can preview the report output and notice that the column headers now display the Sort icon. You can click this icon to sort the product by their name, unit price, amount of units in stock, and units on order. Sorting data within each group is independent of other groups.
The final version of report is available at the demo web-site.