Tablix Data Region in Reports
In This Topic
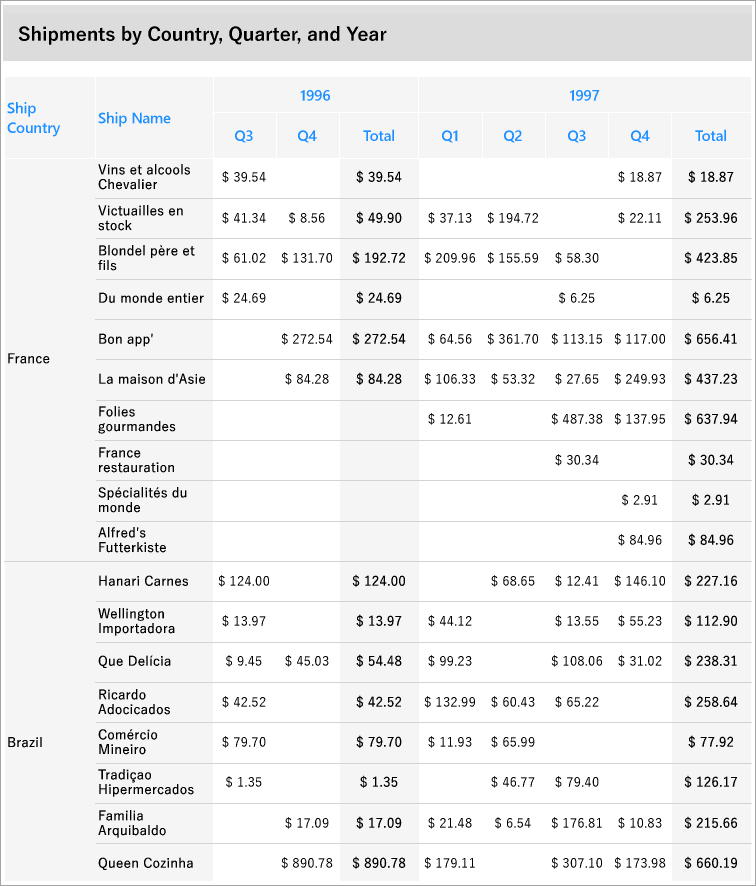
Let us create an RDLX report that uses the Tablix data region to display shipments by country, quarter, and year. To display a summarized value for each quarter and year, we will add additional adjacent rows/columns or parent or child row/column groups to the tablix. The report connects to the 'Orders' JSON data available here.
The final report will look like as shown.
Create a Report
In the ActiveReports Designer, create a new RDLX report.
If you are creating a new report in the Visual Studio Integrated Designer, see
Quick Start.
Bind Report to Data
As you create a new report, you can configure the report data connection in the Report Wizard. You can also access the Report Data Source dialog by right-clicking the Data Sources node in the Report Explorer and then selecting the Add Data Source option. See JSON for details.
- On the Choose Data Source Type screen of the wizard, select JSON and click Next.
- To specify JSON File Path, click the Browse button and navigate to the desired file on your system. This report uses the 'DimEmployees.json' sample data source that can be downloaded from the following URL:
https://demodata.mescius.io/northwind/odata/v1/Orders
- Click the Next option and configure the dataset by adding a valid query. Enter OrdersDataset into the Name field and select the node from the data tree in the Path section to generate the path. The resulting query is displayed in the Query field.
- Click Next to proceed to the final screen of the Report Wizard.
- Review the summary of the report and click Finish to successfully add the report with the JSON data source.
Design Report Layout
- Drag and drop the Tablix data region on the report's design area.
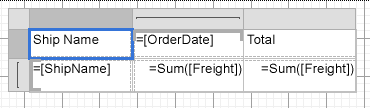
- From the dataset, drag and drop the [ShipName] field onto the Row Group area.
- Select the textbox on the upper-left corner of the tablix and set its Value property to 'Ship Name'.
- Then, drag and drop the [OrderDate] field onto the Column Group area.
- Similarly, drag and drop the [Freight] field onto the Values area, which is the body of the tablix. Note that the [Freight] field changes to Sum(Freight).
- In the Properties pane, set the Format property for the Freight field to Currency.
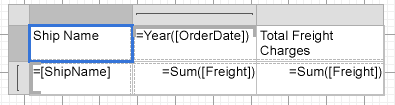
- Right-click the OrderDate column group area and select the Add Total > After option from the context menu to display the total freight charges for the order years.
Manage Data
In a Tablix data region, you need to manage how a grouped data is rendered across the rows and columns. This is done by using Group Expressions as explained below.
- Modify the =Fields!OrderDate.Value expression to =Year(Fields!OrderDate.Value) to display only the Year part of the date in the textbox of the column group.
- With the Tablix data region selected, go to the Group Editor
 to display row groups and column groups.
- Select Tablix1_OrderDate1 column group and go to the Properties pane.
- In the Group Expressions property, click Show Items.
- Update the Group Expression to =Year(Fields!OrderDate.Value).
- Update the textbox with Total label to 'Total Freight Charges'.
Add Row and Column Groups
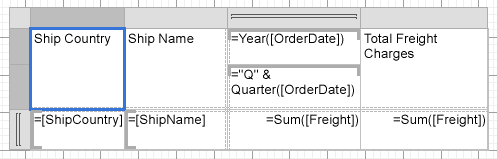
Let us add row and column groups to the tablix data region. We will add a child group to the OrderDate column group to display total prices for each quarter of a year. Similarly, we will add a parent group ShipCountry to ShipName row group to show countries and group the ship names according to the country.
- Right-click the OrderDate column group area to view options in the context menu.
- Go to Column Group and select the Child option.
- From the Group Editor, select the newly added child group i.e. Tablix1_ColumnGroup1 and go to the Properties pane.
- In the Group Expressions property, click Show Items and click Add.
- Set the Group Expression to =Quarter(Fields!OrderDate.Value).
- Now, select the OrderDate child group area in the tablix and set its Value property to ="Q" & Quarter(Fields!OrderDate.Value).
- Similarly, right-click the ShipName row group area to add a parent group from the context menu.
- Go to Row Group and select Parent option.
- From the Group Editor, select the newly added parent group i.e. Tablix1_RowGroup1 and go to the Properties pane.
- In the Group Expressions property, click Show Items and click Add.
- Set the Group Expression to =Fields!ShipCountry.Value.
- Now, select the ShipCountry row group area in the tablix and set its Value property to =Fields!ShipCountry.Value.
- Provide a label Ship Country to the column displaying the ship country.
- Merge the [Ship Country], Ship Name, and Total Freight Charges textboxes with the empty adjacent cells.
Add Totals to the Groups
We will add a total row to display the sum of freight charges for each country and a subtotal column to display the total freight charges for each quarter of the order year.
- Right-click the ShipCountry column group area and select the Add Total > After option from the context menu.
- Similarly, right-click the OrderDate child group area and select the Add Total > After option from the context menu.
Add Report Title and Preview Report
- To add the report title, drag and drop the TextBox control to the PageHeader section and set its Value property to 'Shipments by Country, Quarter, and Year'.
- Improve the appearance of the report and preview.
See Also