- Getting Started
-
Topics
- Wijmo
-
Chart
- Basic
-
Advanced
- Animation
- Annotations
- Conditional Formatting
- Data Labels
- Export
- Grouping and Drilldown
- Hit-Testing
- Interpolating Nulls
- Legend and Titles
- Line Markers
- Plot Areas
- Range Selectors
- Selection
- Sorting & Filtering
- Styling Series
- Toggle Series Visibility
- Tooltips
- Zooming
- Financial
- SpecialCharts
- Axes
- Analytics
- Map
- Cloud
- Gauge
- Grid
- OLAP
- Input
- Nav
- Viewer
Radar & Polar Charts with FlexRadar
Use the wijmo.radar.FlexRadar control to create radar and polar charts. This topic includes features unique to the FlexRadar control. FlexRadar shares most of the same API and featureset with FlexChart.
Basic Radar Features
The FlexRadar control has some basic properties that allow you to customize its layout and appearance:
- chartType: Specifies the control's chart type.
- startAngle: Starting at the 12 o'clock position, specifies the angle to start drawing radar.
- totalAngle: Specifies the total angle to draw radar.
- reversed: Determines whether the control should draw radar clockwise (false) or counterclockwise (true).
- stacking: Determines whether and how the series objects are stacked.
Supported Radar Chart Types
The chartType for FlexRadar is a subset of the core chart types. If the bindingX is bound to string values the result will be a radar chart. If the bindingX is bound to a numeric field it will render a polar chart. The chart types include:
- Column
- Scatter
- Line
- LineSymbols
- Area
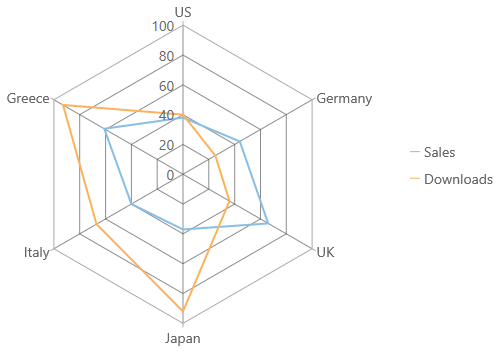
Radar Example:
import * as chart from '@mescius/wijmo.chart';

var myRadarChart = new chart.FlexRadar('#myRadarChart', {
    itemsSource: getData(),
    bindingX: 'country',
    chartType: 'Line',
    startAngle: 0,
    totalAngle: 360,
    series: [
        { name: 'Sales', binding: 'sales' },
        { name: 'Downloads', binding: 'downloads' }
    ]
});
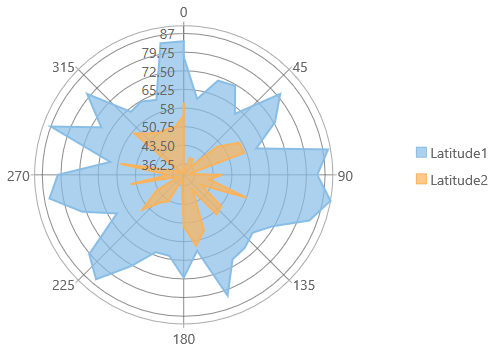
Polar Example:
import * as chart from '@mescius/wijmo.chart';

var myPolarChart = new chart.FlexRadar('#myPolarChart', {
    itemsSource: getData(),
    bindingX: 'longitude',
    chartType: 'Area',
    startAngle: 0,
    totalAngle: 360,
    series: [
        { name: 'Latitude 1', binding: 'latitude1' },
        { name: 'Latitude 2', binding: 'latitude2' }
    ]
});