In This Topic
Let's say that we want to create a report that shows the photos of employees along with their details including name, job title, date of birth, mobile, email, and department. For such a report, we will use the BandedList control with Image control in the details band along with other TextBox controls. The report connects to 'DimEmployees' JSON data available here.
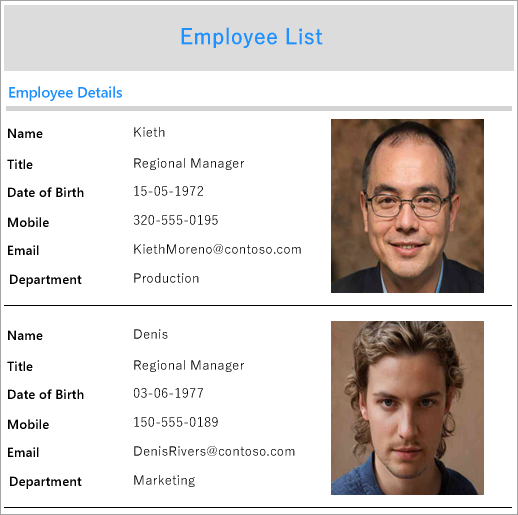
The final report will look like as shown.
Create a Report
In the ActiveReports Designer, create a new Page report.
If you are creating a new report in the Visual Studio Integrated Designer, see
Quick Start.
Bind Report to Data
As you create a new report, you can configure the report data connection in the Report Wizard. You can also access the Report Data Source dialog by right-clicking the Data Sources node in the Report Explorer and then selecting the Add Data Source option. See JSON for details.
- On the Choose Data Source Type screen of the wizard, select JSON and click Next.
- To specify JSON File Path, click the Browse button and navigate to the desired file on your system. This report uses the 'DimEmployees.json' sample data source that can be downloaded from the following URL:
https://demodata.mescius.io/contoso/odata/v1/DimEmployees
- Click the Next option and configure the dataset by adding a valid query. Enter EmployeesDataset into the Name field and select the node from the data tree in the Path section to generate the path. The resulting query is displayed in the Query field.
- Click Next to proceed to the final screen of the Report Wizard.
- Review the summary of the report and click Finish to successfully add the report with the JSON data source.
Design Report Layout
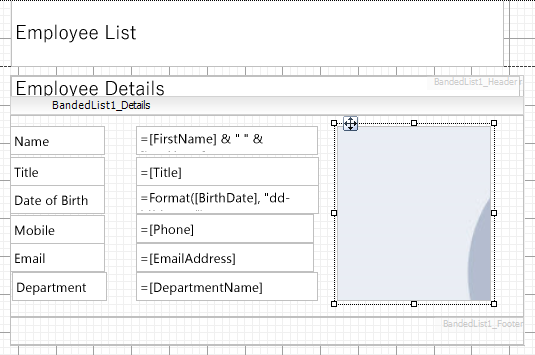
- Drag and drop the BandedList control onto the report's designer.
- Drag few TextBox controls to the Details band of the BandedList control, and set their Value property as follows:
- TextBox1: Name
- TextBox2: =Fields!FirstName.Value & " " & Fields!LastName.Value
- TextBox3: Title
- TextBox4: =Fields!Title.Value
- TextBox5: Date of Birth
- TextBox6: =Format(Fields!BirthDate.Value, "dd-MM-yyyy")
- TextBox7: Mobile
- TextBox8: =Fields!Mobile.Value
- TextBox9: Email
- TextBox10: =Fields!EmailAddress.Value
- TextBox11: Department
- TextBox12: =Fields!DepartmentName.Value
- Drag and drop the Image control and set its properties as follows:
- To provide a heading (label) to the data displayed in the text boxes in Details band, drag and drop a TextBox control onto the Header band of the BandedList control and set its Value property to 'Employee Details'.
- To add the report title, drag and drop the TextBox control to the PageHeader section and set its Value property to 'Employee List'.
- Improve the appearance of the report and preview.
See Also