
Get Started With Pageless Reports
Introduction
A pageless report is a method for displaying data in an unpaginated manner, with content divided among sections instead of pages. This layout type is suitable for creating highly dynamic, interactive data visualizations that do not need to be printed or exported to PDF.
In this tutorial, we will build a Pageless Sales Report from the ground up, providing hands-on experience with the typical report design process.
By the end, you will be able to do the following:
Create a new pageless report
Bind the report to the OData API with multiple endpoints
Use the OData
$selectquery option to reduce the volume of retrieved dataCreate data set calculated fields
Create the report parameter for interaction with a report reader
Build a runtime filter panel using the
Listdata region and theApply Parametersinteractive actionConstruct
TableandChartdata regions that filter data at runtimeCreate scrollable containers
Upon completion of all tutorial steps, the final report will look like this: live demo.
Prerequisites
This tutorial assumes that you have the Standalone Report Designer up and running. For detailed information on how to start with the Standalone Report Designer, please visit the linked tutorial. In addition, please ensure you have a stable internet connection, as it is required to access the Demo Data Hub.
Creating a New Report
To create a new report in the Standalone Report Designer, follow these steps:
Click on the
Filemenu.Select the
Newoption.From the templates available, choose the
Pageless Layouttemplate.This will create a new report using the Pageless Layout template.
Data Binding
Data Binding is the process that establishes a connection between the report and the data it is intended to display. In this tutorial, we will use the MESCIUS Demo OData API. This API contains the sales data for a fictitious company called Contoso—a manufacturing, sales, and support organization with more than 100,000 products.
Adding Data Source
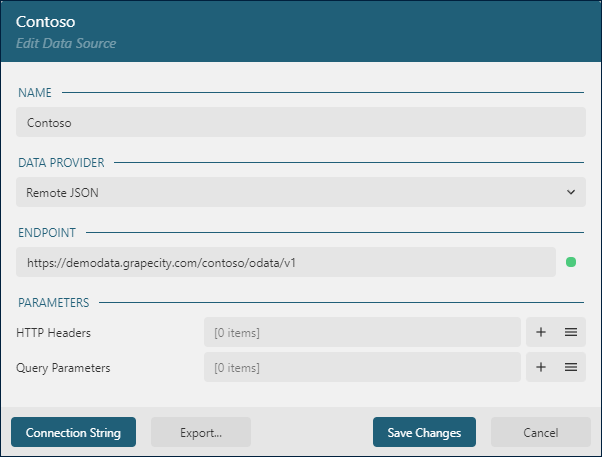
You can think of the Contoso OData API as a "database" that you can connect to using its root URL, https://demodata.mescius.io/contoso/odata/v1. This API provides multiple "tables," represented by endpoints such as /DimCustomers, /DimStores, and /DimProducts. To establish a connection to this "database," you can create a Report DataSource using the following steps:
Open the
Datapanel in the property inspector and click theAddbutton.In the
Data Source editordialog, enterContosoin theNAMEfield andhttps://demodata.mescius.io/contoso/odata/v1in theENDPOINTfield.Click the
Save Changesbutton to finalize the data source creation.
Adding a Supplemental Data Set
Data Sets represent one or more endpoints of the Data Source. For the Sales Report, we need to access data from the /DimPromotions, and /FactSales endpoints of the Contoso Data Source that we added in the previous section. The first data set is supplemental, and we will use it to obtain the discount information about a sales entity. Follow these steps to add the Promotions data set:
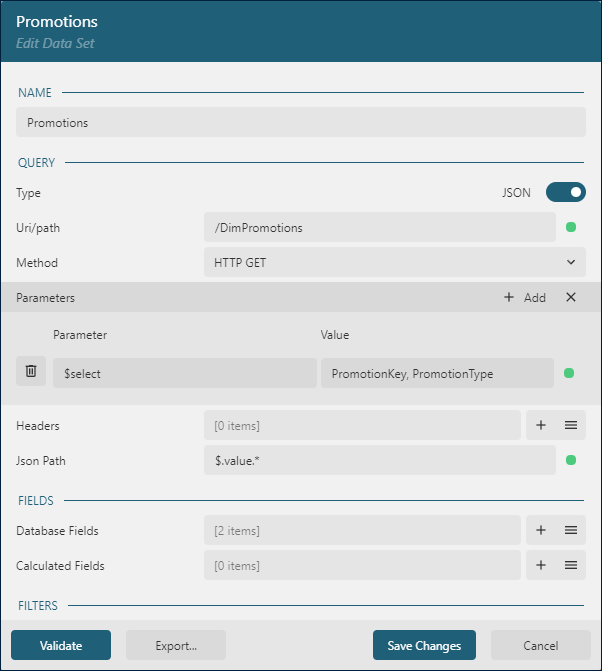
Click the
+icon next to theContosoData Source in the Data panel.In the
Data Set Editordialog, enter Promotions in theNAMEfield, /DimPromotions in theUri/Pathfield, and $.value.* in theJson Pathfield.By default, each Promotion record includes 14 fields, but we don't need them all. To limit the retrieved fields, we use the OData
$selectquery option via a query parameter.Click the
+icon on the right side of the Parameters section.In the Parameter field of the newly added Parameter item, enter $select.
In the Value field of the same Parameter item, enter PromotionKey, PromotionType.
Click the
Validatebutton.Ensure that the DataBase Fields section displays
[2 items]text.Click the
Save Changesbutton.
Adding the Sales Data Set
Next, we'll add the Sales data set. This will provide the actual data that our report will visualize.
Click the
+icon next to theContosoData Source in theDatapanel.In the
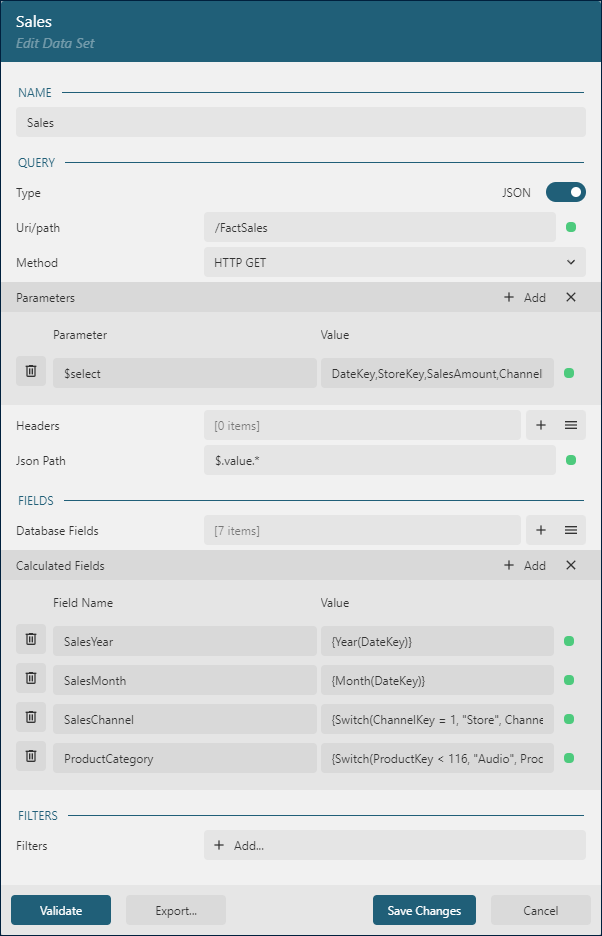
Data Set Editordialog:Enter
Salesin theNAMEfieldEnter
/FactSalesin theUri/PathfieldEnter
$.value.*in theJson Pathfield
Each Sale record includes 19 fields by default, but we don't need all of them. To limit the fields retrieved, we'll use the OData $select query option with a query parameter.
Click the
+icon on the right side of theParameterssection.For the new parameter item:
Enter
$selectin theParameterfieldEnter
DateKey,StoreKey,SalesAmount,ChannelKey,ProductKey,SalesQuantity,PromotionKeyin theValuefield
Next, click the Validate button, and ensure that the DataBase Fields section displays [7 items].
To simplify the report design process, we'll add several calculated fields. These are values derived from the fields returned by the data set.
Click the
+icon on the right side of theCalculated Fieldssection.For the new calculated field:
Enter SalesYear in the
Field NamefieldEnter {Year(DateKey)} in the
Valuefield
This expression uses the Year function to return the sales date's year.
Repeat this process to add the following calculated fields:
SalesMonth with the
Value{Month(DateKey)}SalesChannel with the
Value{Switch(ChannelKey = 1, "Store", ChannelKey = 2, "Online", ChannelKey = 3, "Catalog", ChannelKey = 4, "Reseller")}ProductCategory with the
Value{Switch(ProductKey < 116, "Audio", ProductKey >= 116 And ProductKey < 338, "TV and Video", ProductKey >= 338 And ProductKey < 944, "Computers", ProductKey >= 944 And ProductKey < 1316, "Cameras", ProductKey >= 1316, "Cell Phones")}Finally, click the
Save Changesbutton.
The last two expressions use the Switch function to determine the sales channel name by the channel's ID(ChannelKey) and the product category by the product's ID (ProductKey)
Adding a Report Parameter
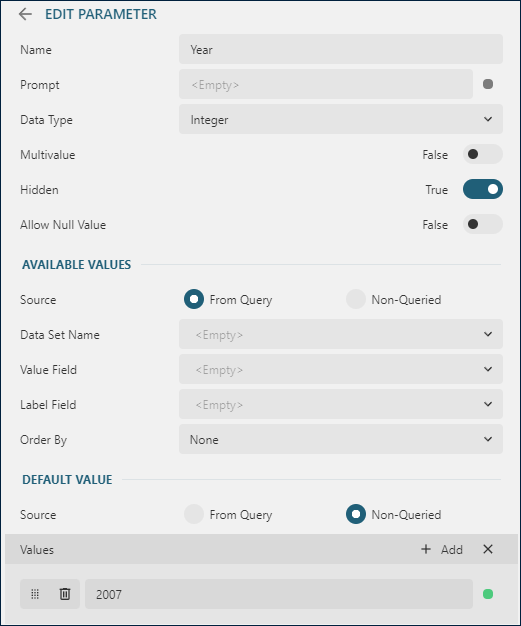
Our Sales Report will provide the user the ability to filter sales data by sales year. We'll accomplish this by using report parameters. To create the Year report parameter, follow the steps outlined below:
Navigate to the
Datapanel and click the+ Addbutton in theParameterssection.In the
Namefield, typeYear.From the
Data Typedropdown, selectInteger.Set the
Hiddenflag toTrue.In the
Default Valuesection:Select the
Non-QueriedoptionClick the
AddbuttonSet the default value to
2007
Adding the Filter Panel
To enable report readers to set the Year parameter values, we'll use an interactive panel displaying all distinct years from the Sales dataset. First click inside the section's area and set the Height property to 10in, then follow the next steps.
Access the toolbox: Use the
Hamburgermenu on the left side of the toolbar to expand the toolbox.Add a container: Drag and drop the Container report item from the toolbox to the section's top-left corner.
Configure the container: Switch to the Properties panel in the Property inspector and set the following properties for the container:
Property
Value
Name
FilterPanelBorder Width
0.25ptBorder Style
SolidBorder Color
GainsboroLeft
0.5inTop
0.5inWidth
9inHeight
1inAdd a TextBox: Drag and drop the TextBox report item from the toolbox to the top-left corner of the newly added container. Configure the TextBox with the following properties:
Property
Value
Name
FilterPanelHeaderValue
Click year to filter dataFont Weight
BoldText Align
CenterVertical Align
MiddleLeft
0.25inTop
0.25inWidth
2.25inHeight
0.5inAdd a List: Drag and drop the List report item from the toolbox to the container's area. Configure the List with the following properties:
Property
Value
Name
YearListAction Type
Apply ParametersApply Parameters Configuration
Parameter:
Year, Action:Set, Value:{SalesYear}Data Set Name
SalesGroup Expression
{SalesYear}Text Align
CenterVertical Align
MiddleLeft
2.75inTop
0inWidth
6inHeight
1inRows or Columns Count
3Add a TextBox to the List: Drag and drop the
TextBoxreport item from the toolbox to the List's top-left corner. Configure this TextBox with the following properties:Property
Value
Name
YearTextValue
{SalesYear}Default Border Width
0.5ptDefault Border Style
{IIF(SalesYear = @Year, "Dashed", "None")}Default Border Color
BlackText Align
CenterVertical Align
MiddleLeft
0.5inTop
0.5inWidth
9inHeight
1in
Upon successful completion of these steps, the report design is expected to appear as follows
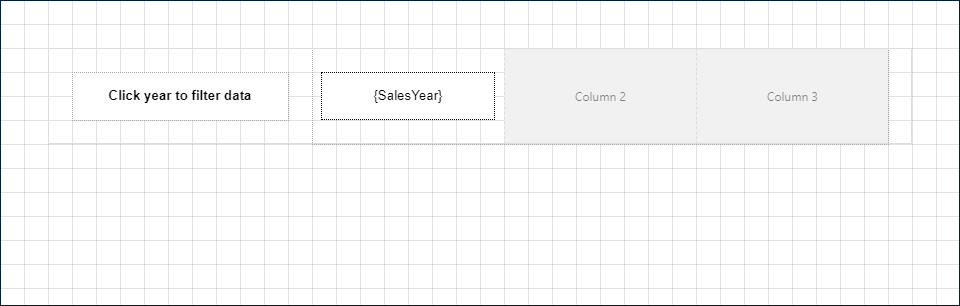
Upon previewing the report, you'll observe that the years 2007, 2008, and 2009 are displayed in a horizontal format. Notably, the year that aligns with the current parameter's value is emphasized with a border. You can click on any year to adjust the parameter value accordingly.
Adding the Summary Table
Next, we will add a table that displays the monthly sales for the currently selected year.
Switch to Design Time: Navigate back to the report design by clicking the
Backbutton located in the top-left corner of the UI.Access the Toolbox: Expand the toolbox by clicking on the
Hamburgermenu, located on the left side of the toolbar.Add a Table: Drag and drop the Table report item from the toolbox to the section's area below the filter panel added in the previous step. Set the following properties for the table:
Property
Value
Name
SummaryTableBorder Width
0.25ptBorder Style
SolidBorder Color
GainsboroLeft
0.5inTop
1.75inData Set Name
SalesConfigure Table Filter: In the properties of the table, find the
Filterproperty and click theAddbutton. In the Filters editor, click theAdd...button, select theSalesYearfield, and on the right side of the=operator, select theYearparameter from the drop-down list.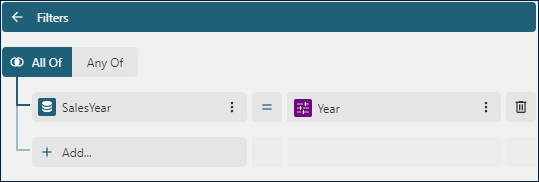
Configure Table Grouping: In the group editor of the table, click the
SummaryTable_DetailsGroup1item. Add{SalesMonth}to both theGroupingExpressionsandSortExpressionslists. This configuration will generate one detail row per month and sort them in ascending order.Configure Table Columns: Right-click the column handler of the 3rd column of the table and select the
Deletecommand from the drop-down menu. Set the width of the 1st column to2.5inand the width of the 2nd column to1.5inby clicking the corresponding column handlers and modifying properties in the property inspector.Configure Table Cells: Each cell of the table contains a TextBox report item that can be selected by clicking the table cells. Use the table below to set properties for these textboxes.
Row
Column
Property
Value
1st
1st
Name
SummaryTableHeaderValue
Monthly sales in {@Year}2nd
1st
Name
SalesMonthValue
{MonthName(SalesMonth)}2nd
2nd
Name
SalesAmountValue
{SalesAmount}Format
c23rd
1st
Name
TextTotalValue
TotalFont Weight
BoldText Align
Right3rd
2nd
Name
SalesAmountTotalValue
{Sum(SalesAmount)}Format
c2Font Weight
Bold
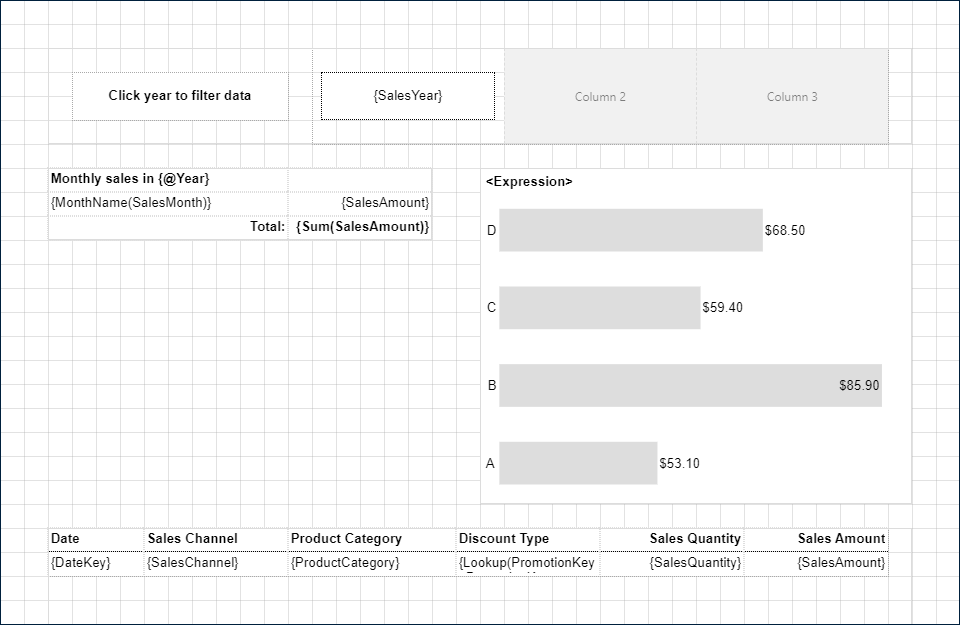
Upon successful completion of these steps, the report design is expected to appear as follows
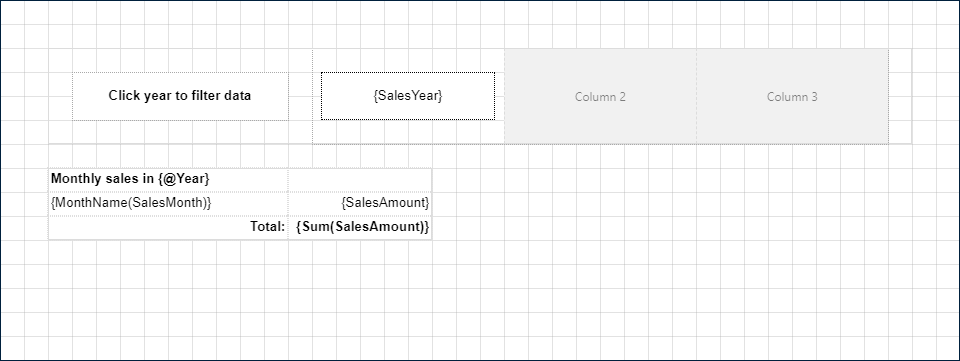
Now, you can preview your report and switch between years in the filter panel. The table will re-render to display data for the currently selected year!
Adding the Chart
In this section, we're going to add a chart that represents the sales amount per sales channel for the currently selected year. Here are the steps:
Switch to Design Time: Return to the report design view by clicking the
Backbutton in the top-left corner of the UI.Access the Toolbox: Click on the
Hamburgermenu on the left side of the toolbar to expand the toolbox.Add a Chart: Drag and drop the Chart report item from the toolbox into the section area adjacent to the table from the previous step. The Chart Wizard will then appear.
Configure Chart data: In the
Data and Typesection of the Chart Wizard, selectSalesfrom theSelect Data Setdrop-down menu and choose theBarplot type.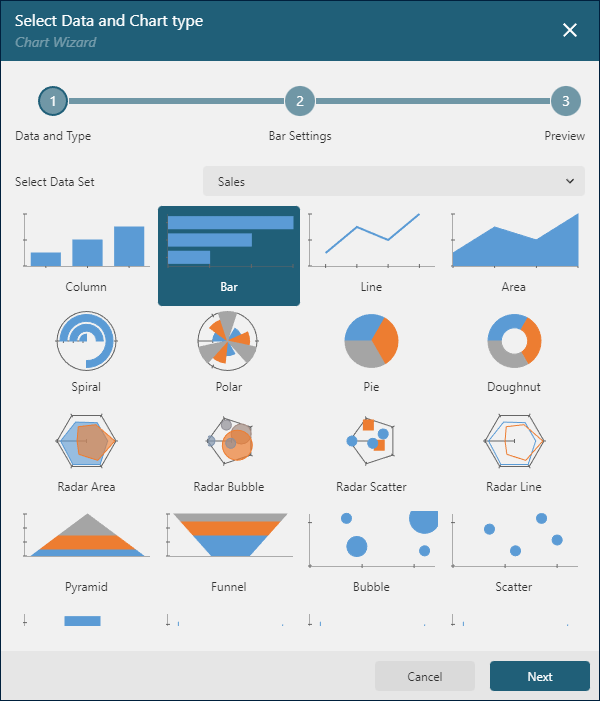
Then, click
Next. In theBar Settingspage, add aData Valuesetting theFieldto{SalesAmount}and theAggregatetoSum. For theData Categories, set the field to{SalesChannel}and clickNext.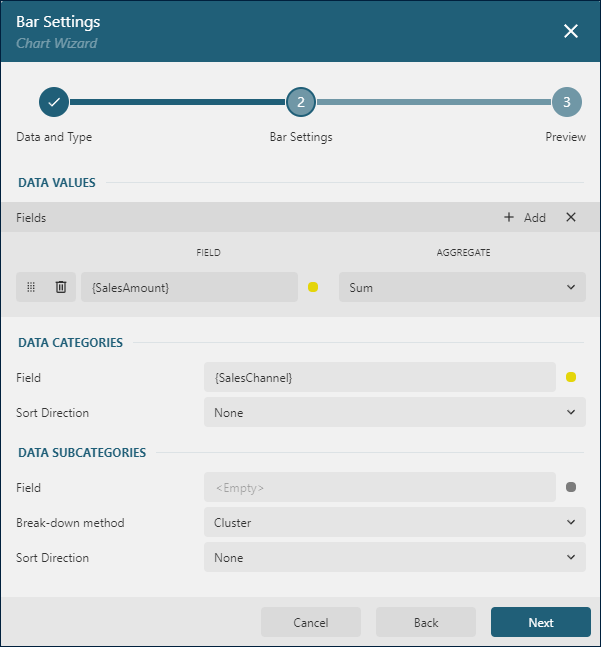
On the
Previewpage, select theGrayscalein theSelect chart palettedrop-down and clickFinish.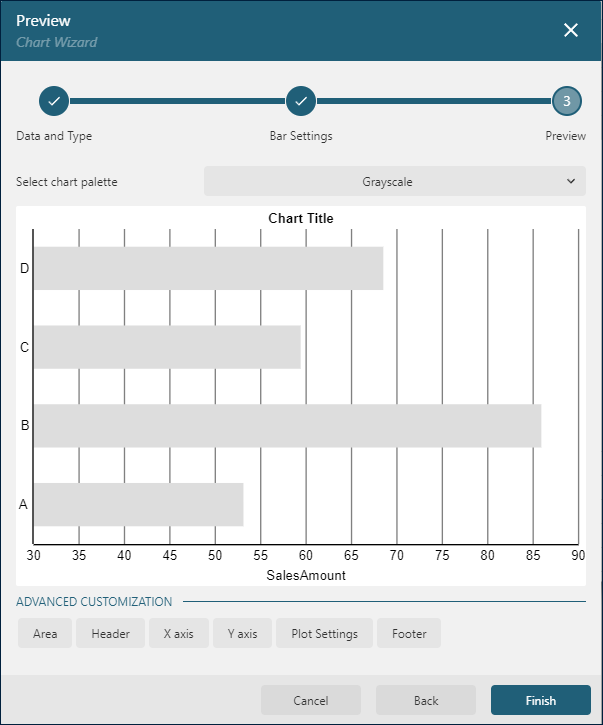
Open the Report Explorer: Click on the
Explorerbutton underneath theHamburgermenu and pin the report explorer to keep it visible, facilitating navigation within the chart areas.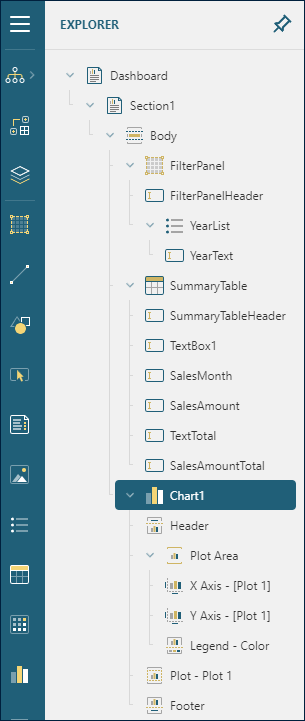
Set general Chart properties: In the
Report Explorer, select theChart1item. Then set the following properties in the properties panel:Property
Value
Name
ChartSalesPerChannelBorder Width
0.25ptBorder Style
SolidBorder Color
GainsboroLeft
5inTop
1.75inWidth
4.5inHeight
3.5inConfigure Chart Filter: Find the
Filterproperty within the chart properties and click theAddbutton. In the Filters editor, clickAdd..., select theSalesYearfield, and select theYearparameter from the drop-down list on the right side of the=operator.Configure the Chart Header: In the
Report Explorer, select theHeaderitem underChartSalesPerChanneland set the following properties:Property
Value
Caption
Sales per Channel in {@Year}Text Align
LeftVertical Align
TopPadding
2ptConfigure the X Axis: Select the
X-Axis - [Plot1]item under thePlot Areain theReport Explorer, and set theVisibleflag in theLinesection toFalse.Configure the Y Axis: In the
Report Explorer, click theY-Axis - [Plot1]item under thePlot Area, and set these properties:Property
Value
Title
Line->Visible
FalseLabels->Visible
FalseMajor Grid->Visible
FalseConfigure the plot: Select the
Plot - Plot1item underChartSalesPerChannelin theReport Explorer, and apply the following settings:Property
Value
Category Sort Expression
{Sales Amount}Category Sort Direction
AscendingCategory Sorting Aggregate
SumLabel Text->Template
{valueField.value:c2}(this can be set in the expression editor)
Upon successful completion of these steps, the report design is expected to appear as follows
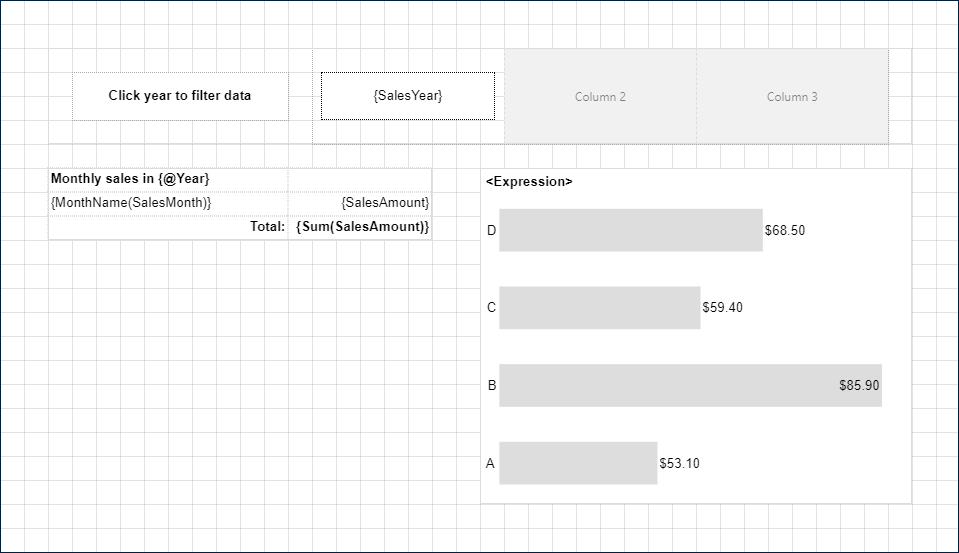
After these steps, you can preview your report and switch between years using the filter panel. Both the chart and the table will dynamically update to display data for the currently selected year!
Adding the Details Table
Next, we will add the table that will display the details of each sale within the currently selected year. As there could be many individual sale records, the table will be scrollable and will have the frozen column headers.
Switch to Design Time: Navigate back to the report design by clicking the
Backbutton located in the top-left corner of the UI.Access the Toolbox: Expand the toolbox by clicking on the
Hamburgermenu, located on the left side of the toolbar.Add a container: Drag and drop the Container report item from the toolbox to the section's area below the summary table.
Configure the container: Using the Property inspector, set the following properties for the container:
Property
Value
Name
DetailsTableContainerBorder Width
0.25ptBorder Style
SolidBorder Color
GainsboroLeft
0.5inTop
5.5inWidth
9inHeight
4inCan Grow
FalseOverflow
AutoAdd a Table: Drag and drop the Table report item from the toolbox to the top-left corner of the newly added container. Set the following properties for the table:
Property
Value
Name
SummaryTableLeft
0inTop
0inData Set Name
SalesFrozen Rows
1Configure Table Filter: In the properties of the table, find the
Filterproperty and click theAddbutton. In the Filters editor, click theAdd...button, select theSalesYearfield, and on the right side of the=operator, select theYearparameter from the drop-down list. It's the same filter as was added for the summary table and the chart.Configure Table Columns: Right-click the column handler of the 3rd column of the table and select the
Column->Insert Column->More...command from the drop-down menu. In theInsert Columndialog, set theCountto3and the position toRightand click theInsertbutton. By clicking on the column handlers and modifying theWidthproperty in the Property inspector, set the following column widths:Column
Width
1st
1in2nd
1.5in3rd
1.75in4th – 6th
1.5inConfigure Table Cells: Each cell of the table contains a TextBox report item that can be selected by clicking the table cells. Use the table below to set properties for these textboxes.
Row
Column
Property
Value
1st
1st
Name
DateHeaderValue
Date2nd
1st
Name
DateValueValue
{DateKey}Text Align
Left1st
2nd
Name
SalesChannelHeaderValue
Sales Channel2nd
2nd
Name
SalesChannelValueValue
{SalesChannel}1st
3rd
Name
ProductCategoryHeaderValue
Product Category2nd
3rd
Name
ProductCategoryValueValue
{ProductCategory}1st
4th
Name
DiscountTypeHeaderValue
Discount Type2nd
4th
Name
DiscountTypeValueValue
{Lookup(PromotionKey, PromotionKey, PromotionType, "Promotions")}1st
5th
Name
SalesQuantityHeaderValue
Sales QuantityText Align
Right2nd
5th
Name
SalesQuantityValueValue
{SalesQuantity}1st
6th
Name
SalesAmountHeaderValue
Sales AmountText Align
Right2nd
6th
Name
SalesAmountValueValue
{SalesAmount}Format
c2Configure Table Rows: Click the handler of the 1st row and switch to the
TextBoxtab in the Property inspector. This way, you can set properties for all textboxes contained in the selected row simultaneously:Property
Value
Background Color
WhiteBorder Width
0.5ptBottom Border Style
SolidBorder Color
Black
Upon successful completion of these steps, the report design is expected to appear as follows
You now can preview the report, toggle between different years, and scrutinize sales statistics presented in the summary table, chart, and details table. These elements dynamically update to reflect the data corresponding to your selected year.