[{"id":"e0909540-8bde-4587-bb4d-02445746db2a","tags":[{"name":"upd","color":"#7e678a","productId":"d699a6af-e150-4da3-ab30-25fd97934601","links":null,"id":"fe610228-9cf6-417f-813a-dcbfd25406c3"}]},{"id":"464b8e03-462d-4aed-8818-05d32ec3bf00","tags":[{"name":"upd","color":"#7e678a","productId":"d699a6af-e150-4da3-ab30-25fd97934601","links":null,"id":"fe610228-9cf6-417f-813a-dcbfd25406c3"}]},{"id":"75b66fd4-b740-443d-bc6e-1782048b60a6","tags":[{"name":"upd","color":"#7e678a","productId":"d699a6af-e150-4da3-ab30-25fd97934601","links":null,"id":"fe610228-9cf6-417f-813a-dcbfd25406c3"}]},{"id":"fd5d021d-0210-4d74-ba42-1a39ef14a385","tags":[{"name":"upd","color":"#7e678a","productId":"d699a6af-e150-4da3-ab30-25fd97934601","links":null,"id":"fe610228-9cf6-417f-813a-dcbfd25406c3"}]},{"id":"a20f26ac-cd31-4e4d-9454-1e035b0f1587","tags":[{"name":"upd","color":"#7e678a","productId":"d699a6af-e150-4da3-ab30-25fd97934601","links":null,"id":"fe610228-9cf6-417f-813a-dcbfd25406c3"}]},{"id":"7fce7040-1bb1-4a61-9fb7-2e19d569de50","tags":[{"name":"upd","color":"#7e678a","productId":"d699a6af-e150-4da3-ab30-25fd97934601","links":null,"id":"fe610228-9cf6-417f-813a-dcbfd25406c3"}]},{"id":"f235557b-9781-471f-bf03-38bae6e3e953","tags":[{"name":"upd","color":"#7e678a","productId":"d699a6af-e150-4da3-ab30-25fd97934601","links":null,"id":"fe610228-9cf6-417f-813a-dcbfd25406c3"}]},{"id":"c8c7b5d5-f5bd-4b68-a12f-3aae9804a844","tags":[{"name":"upd","color":"#7e678a","productId":"d699a6af-e150-4da3-ab30-25fd97934601","links":null,"id":"fe610228-9cf6-417f-813a-dcbfd25406c3"}]},{"id":"dde44832-bb5c-45f3-8ebf-3badbc613cd9","tags":[{"name":"upd","color":"#7e678a","productId":"d699a6af-e150-4da3-ab30-25fd97934601","links":null,"id":"fe610228-9cf6-417f-813a-dcbfd25406c3"}]},{"id":"a0c823ed-e22b-493b-aded-4d201c0fa480","tags":[{"name":"upd","color":"#7e678a","productId":"d699a6af-e150-4da3-ab30-25fd97934601","links":null,"id":"fe610228-9cf6-417f-813a-dcbfd25406c3"}]},{"id":"2f064d57-b088-4bc5-a628-4e0d7e1a0c65","tags":[{"name":"upd","color":"#7e678a","productId":"d699a6af-e150-4da3-ab30-25fd97934601","links":null,"id":"fe610228-9cf6-417f-813a-dcbfd25406c3"}]},{"id":"577a09da-dea1-42db-812f-4eeaa9274ece","tags":[{"name":"upd","color":"#7e678a","productId":"d699a6af-e150-4da3-ab30-25fd97934601","links":null,"id":"fe610228-9cf6-417f-813a-dcbfd25406c3"}]},{"id":"0eb72dd3-8f8f-4039-93a8-500bbde2301e","tags":[{"name":"upd","color":"#7e678a","productId":"d699a6af-e150-4da3-ab30-25fd97934601","links":null,"id":"fe610228-9cf6-417f-813a-dcbfd25406c3"}]},{"id":"3f2ea860-c764-43d8-ae3f-6e3b0314ce67","tags":[{"name":"upd","color":"#7e678a","productId":"d699a6af-e150-4da3-ab30-25fd97934601","links":null,"id":"fe610228-9cf6-417f-813a-dcbfd25406c3"}]},{"id":"3604b8ce-1da0-413f-8274-7df0f7173573","tags":[{"name":"upd","color":"#7e678a","productId":"d699a6af-e150-4da3-ab30-25fd97934601","links":null,"id":"fe610228-9cf6-417f-813a-dcbfd25406c3"}]},{"id":"f290406b-ced1-4c52-abad-979160a79f6b","tags":[{"name":"upd","color":"#7e678a","productId":"d699a6af-e150-4da3-ab30-25fd97934601","links":null,"id":"fe610228-9cf6-417f-813a-dcbfd25406c3"}]},{"id":"d19bc9cd-ff53-4b0d-ab7e-a68c1497c4c6","tags":[{"name":"new","color":"#ed7422","productId":"d699a6af-e150-4da3-ab30-25fd97934601","links":null,"id":"4d7b6a40-ab32-4c71-a381-58f3ffd2653e"}]},{"id":"ac046cee-82b9-4edf-a642-ae6d7cb21ebf","tags":[{"name":"upd","color":"#7e678a","productId":"d699a6af-e150-4da3-ab30-25fd97934601","links":null,"id":"fe610228-9cf6-417f-813a-dcbfd25406c3"}]},{"id":"81eb70e8-f770-4384-9167-bc7c755ad052","tags":[{"name":"new","color":"#ed7422","productId":"d699a6af-e150-4da3-ab30-25fd97934601","links":null,"id":"4d7b6a40-ab32-4c71-a381-58f3ffd2653e"}]},{"id":"1864834b-08ce-43f1-891b-c3cca6e04e95","tags":[{"name":"new","color":"#ed7422","productId":"d699a6af-e150-4da3-ab30-25fd97934601","links":null,"id":"4d7b6a40-ab32-4c71-a381-58f3ffd2653e"}]},{"id":"f96cfec1-420c-4ca7-ab0a-cab482731073","tags":[{"name":"new","color":"#ed7422","productId":"d699a6af-e150-4da3-ab30-25fd97934601","links":null,"id":"4d7b6a40-ab32-4c71-a381-58f3ffd2653e"}]},{"id":"d0dff477-9f56-483a-a9fc-cab648905b41","tags":[{"name":"new","color":"#ed7422","productId":"d699a6af-e150-4da3-ab30-25fd97934601","links":null,"id":"4d7b6a40-ab32-4c71-a381-58f3ffd2653e"}]},{"id":"548568fe-dbd1-4da5-a489-d9b3edf75329","tags":[{"name":"upd","color":"#7e678a","productId":"d699a6af-e150-4da3-ab30-25fd97934601","links":null,"id":"fe610228-9cf6-417f-813a-dcbfd25406c3"}]},{"id":"27658163-a479-432f-a192-dbed286beb3e","tags":[{"name":"new","color":"#ed7422","productId":"d699a6af-e150-4da3-ab30-25fd97934601","links":null,"id":"4d7b6a40-ab32-4c71-a381-58f3ffd2653e"}]},{"id":"793a62d7-460d-4699-9304-edb2941268ac","tags":[{"name":"upd","color":"#7e678a","productId":"d699a6af-e150-4da3-ab30-25fd97934601","links":null,"id":"fe610228-9cf6-417f-813a-dcbfd25406c3"}]},{"id":"8ddd80d5-886f-41b8-8e3f-f73aa8146c8d","tags":[{"name":"upd","color":"#7e678a","productId":"d699a6af-e150-4da3-ab30-25fd97934601","links":null,"id":"fe610228-9cf6-417f-813a-dcbfd25406c3"}]},{"id":"43de3664-261b-4cf9-9945-fb519251f4c7","tags":[{"name":"upd","color":"#7e678a","productId":"d699a6af-e150-4da3-ab30-25fd97934601","links":null,"id":"fe610228-9cf6-417f-813a-dcbfd25406c3"}]},{"id":"94759fce-692f-4779-b5f3-fce5c58f242c","tags":[{"name":"new","color":"#ed7422","productId":"d699a6af-e150-4da3-ab30-25fd97934601","links":null,"id":"4d7b6a40-ab32-4c71-a381-58f3ffd2653e"}]},{"id":"2d6ebfad-f7d1-4cc5-8ba1-fdace3472056","tags":[{"name":"upd","color":"#7e678a","productId":"d699a6af-e150-4da3-ab30-25fd97934601","links":null,"id":"fe610228-9cf6-417f-813a-dcbfd25406c3"}]}]
        
(Showing Draft Content)

Chart Axes

Axes are integral parts of most chart types, and they carry several responsibilities:

  • Provide the coordinate system for one or more plots

  • Display units of measure for visualized data

  • Produce grid lines

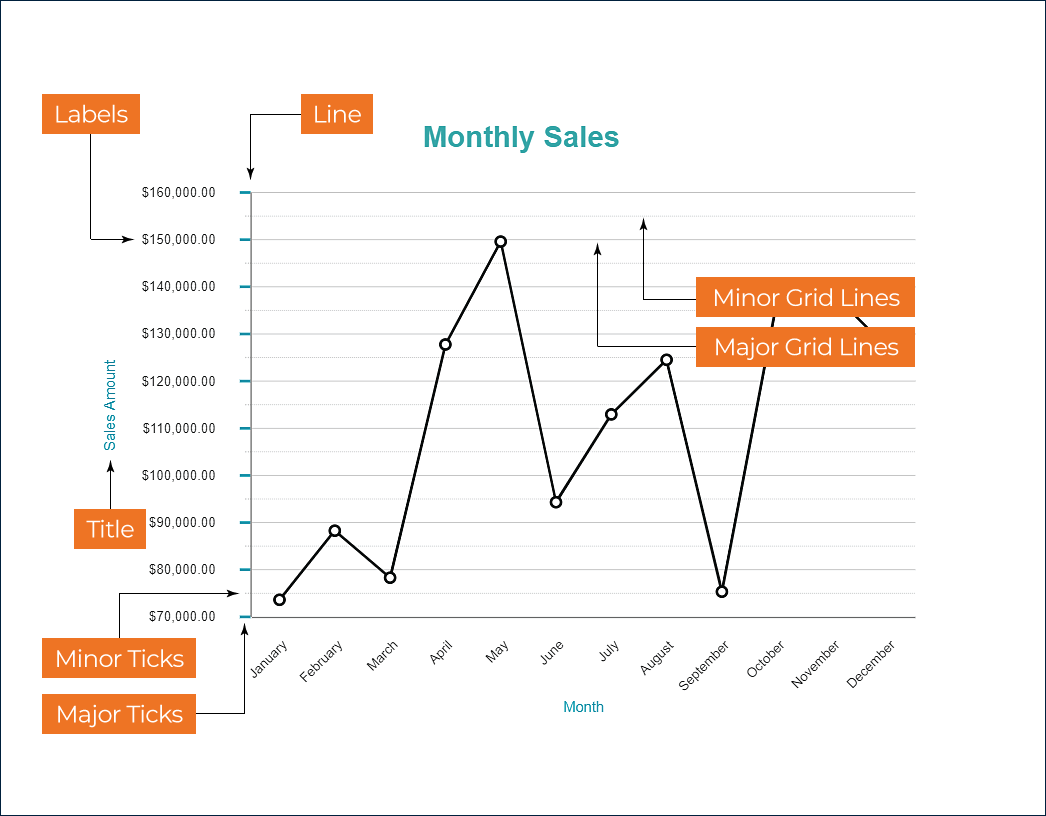
Consequently, an axis consists of multiple optional parts whose composition and configuration determine the axis appearance. The following diagram depicts the vertical axis's anatomy, but the same elements are applicable for horizontal axes.


You can experiment with axis configuration using the Chart Axes Demo - open the link, toggle the Report explorer, select the Y Axis - [Plot 1] node and use the Properties panel to modify the axis configuration that we described in details in the following sections. You could also download the report file and open it in the Standalone Report Designer.

General Axis Properties

Axis Type

Enum value that determines the axis type. Possible values are:

  • X axes handle categorical values, such as product category or month.

  • Y axes handle data values, such as sales amount or average temperature.

You can check the line plot, column and bar plots, or area plot documentation for more information on category and data values.

Plots

The Collection of plot names for which the axis provides the coordinate system. By default, every newly added plot for most chart types automatically gets its axes. However, you can bind an axis to multiple plots by using this property.

Position

An Enum value that determines the position of an axis relative to the containing plot area as per table below.

Position

Vertical Axes

Horizontal Axes

Near

Left side

Bottom Side

Far

Right side

Top Side

None

Eliminates an axis

Eliminates an axis

Origin

The numerical Expression determines an axis's location relative to the containing plot's orthogonal axis.


Note: Try setting the Origin of the Y Axis to 0,1,2,3,4, etc. and the origin of X Axis to 100000, 1500000, etc. in the Chart Axes Demo to see the effect of this property in action.

The Width, Max Width for Y axes, and the Height and Max Height for X axes determine the size of an axis relative to the size of the plot area.

Reversed

If you set this Boolean property to True, the chart flips the default direction of a vertical axis to Top-to-Bottom, and the default direction of a horizontal axis to Right-To-Left. This setting changes the coordinate system of the attached plot, so its shape reverses as well.

Overlapping Labels

An Enum value that determines the appearance of overlapping axis labels. Possible values are:

  • Auto - hides some labels to prevent the overlapping

  • Show - shows all labels even if the overlapping persists

Note: Try setting the Label Angle to 0 for the X Axis in the Chart Axes Demo and compare the report output on the preview when the Overlapping Labels property is Auto and when it is Show.

Title

A string Expression determines the axis title that displays on the left, right, top, or bottom side of an axis depending on its position.


A subset of Text Properties available in the Title section of the Properties panel allows you to set up the text's appearance.

Line

The combination of Line Properties and the boolean Visible property determines the axis line's appearance.

Labels

A subset of Text Properties and the boolean Visible property determine the axis labels' appearance.


In addition, you can set the Label Angle to a numeric value from -90 to 90 that defines the labels' rotation in degrees relative to the axis line.


X axes expose the Label Field property that is an expression that determines the displayed text for each category.


Note: In the Chart Axes Demo, the Label Angle of X Axis is -45 to fit all the month names within the available axis length.

Major Grid and Minor Grid

The combination of Line Properties, the boolean Show Grid Lines property, and Major and Minor intervals determine the appearance of gridlines within the plot area. Minor gridlines split the space between major gridlines.


Note: Try setting the Minor Grid Interval to 2000 for the Y Axis in the Chart Axes Demo to observe the relationships between the major and minor gridlines.

Major Ticks and Minor Ticks

In addition to the gridlines, an axis could display major and minor ticks on various position relative to the axis line. Line Properties and a couple of additional settings determine the ticks appearance:

  • Tick Size - Length expression that sets the ticks length.

  • Tick Marks - Enum value that determines the position of ticks relative to the axis line.

Note: Try setting the Major Tick Marks to different values for the Y Axis in the Chart Axes Demo to observe how this property affects the appearance of the ticks.

Range of scale

You can set the range of values that an axis can handle using the Min and Max numerical expressions in the Scale section.


Note: In the Chart Axes Demo the range of the Y Axis is [70000; 160000].

Scale type

An Enum value that determines the way the axis handles the range of available values:

  • Linear is the default scale type that evenly distributes the range of available values along the axis.

  • Logarithmic scale uses the logarithm of values instead of the values themselves. This way is useful for displaying a vast range of values compactly. You could also set the logarithm base for this scale type.

  • Ordinal scale applies to non-numerical values, such as product categories, which evenly distribute along the axis as per their order.

  • Percentage scale used for Percentage Stacked Column and Bar and Percentage Stacked Area plots.

Note: In the Chart Axes Demo, the scale of the Y Axis is Linear, and the scale of the X Axis is Ordinal.