Create RDLX Dashboard Report
In This Topic
The RDLX Dashboard report is the latest addition to the varied reports that you can design in ActiveReports. To learn about the key features of this report type, see RDLX Dashboard Report.
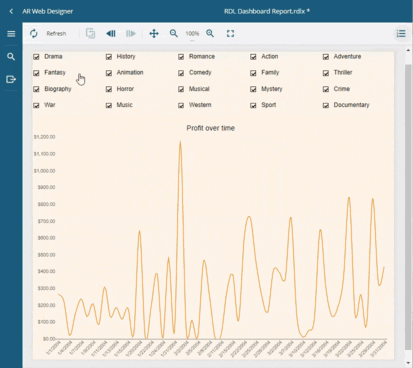
Let us create an interactive RDLX Dashboard Report. The report will use the List and Chart data regions to visualize data from two datasets. In this report, you will be able to interact with the data through the Apply Parameters action and visualize the manipulated data. See the Actionable Parameters topic for more information.
This article explains creating a new report in the ActiveReports Standalone Designer.
If you are creating a new report in the Visual Studio Integrated Designer, see
Quick Start.
Create a Report
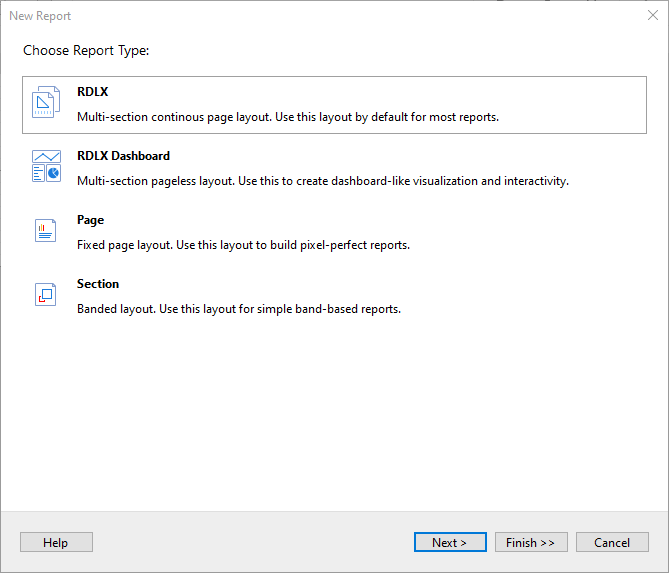
- Create a New Report.
- In the New Report wizard, choose the Report Type as RDLX Dashboard and click Next.
Bind Report to Data
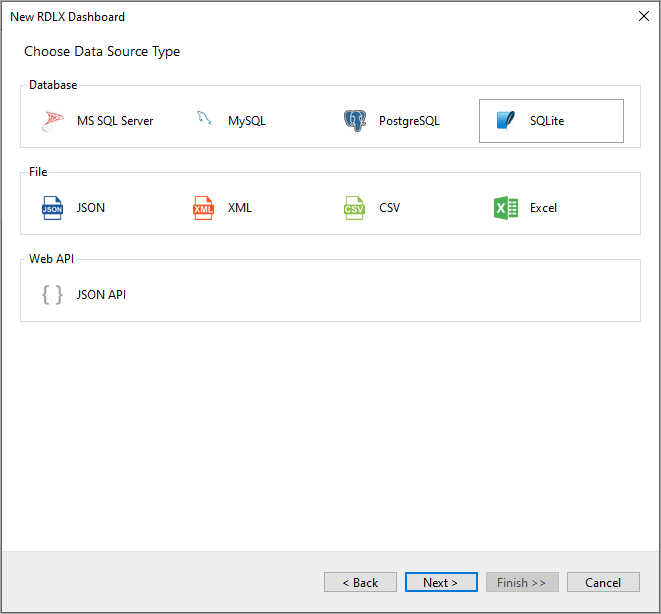
- On the Choose Data Source Type screen of the wizard, select SQLite and click Next.
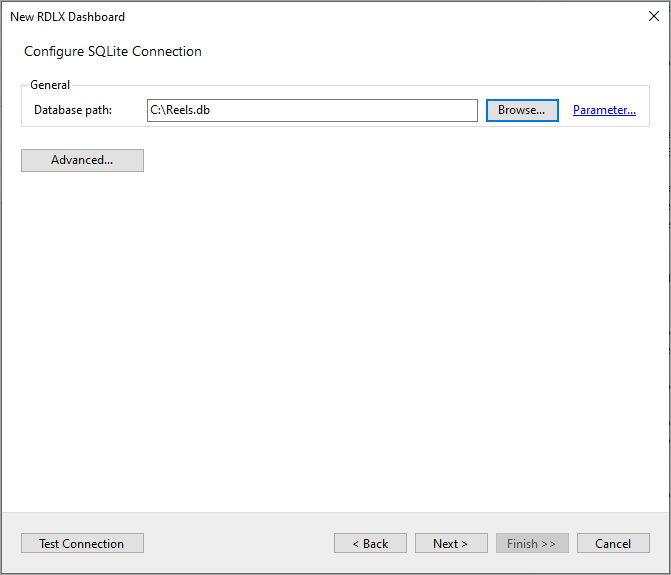
- To specify the Database path, click the Browse button and navigate to the desired file on your system. For example, you can connect to the Reels.db sample data source which can be downloaded from GitHub. See SQLite and Configure ActiveReports topics for more information.
- Then click the Next option and configure the datasets by adding valid queries.
Add Datasets
- On the Configure SQLIte Queries screen, enter Genre in the Name field and the following SQL query:
SELECT * FROM Genre.
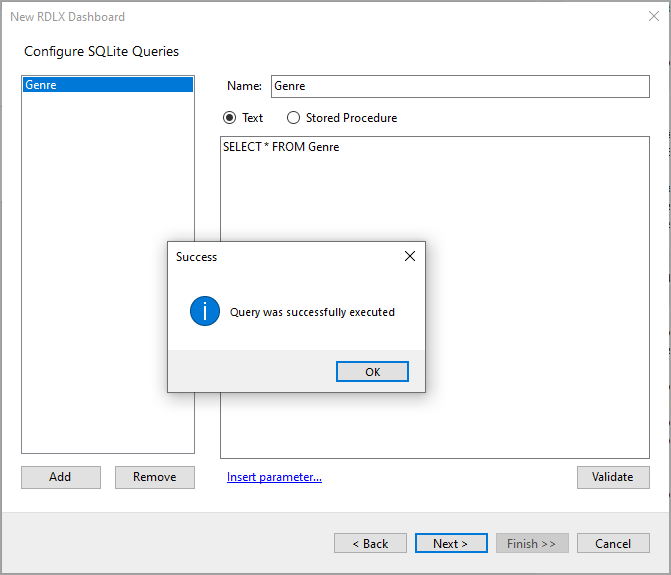
- Click OK to close the dialog. Your data set and queried fields appear as nodes in the Report Explorer.
This dataset contains the following fields:
- Click Add to add another dataset with the name SalesByGenre.
- Enter the following SQL query:
SELECT * FROM SalesByGenre.
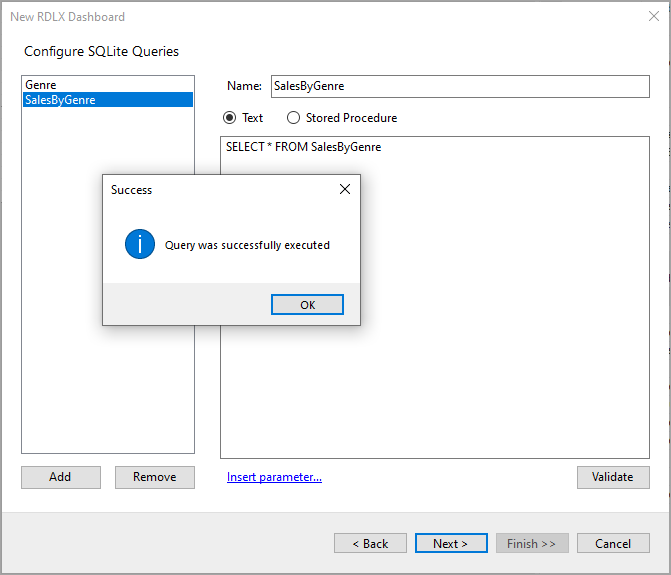
- Click OK to close the dialog. Your dataset and queried fields appear as nodes in the Report Explorer.
This dataset contains the following fields:
- GenreID
- GenreName
- StorePrice
- SaleID
- Quantity
- SalesID
- SaleDate
- Profit
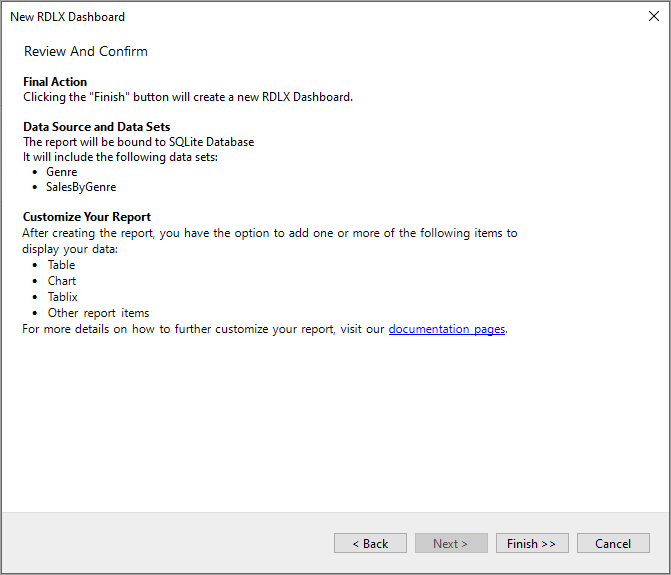
- Click Next. On the final screen of the Report Wizard, review the summary of the report and click Finish to successfully add the report with the SQLite data source.
Add a Field to Dataset
- In the Report Explorer, right-click the Genre dataset and select Edit.
- In the DataSet dialog, go to the Fields page and add a new field with Name as GenreIDInt and Value as =Convert.ToInt32([GenreID]).
You will see how we use the GenreIDInt field to avoid type mismatch.
- Click OK to save your changes.
Add Report Parameter
- In the Report Explorer, right-click the Parameters node and select Add Parameter.
- In the Report - Parameters dialog that appears, add a name for the parameter, 'paramGenreID'.
- Set the Data Type to 'Integer'.
- Select the Multivalue and Hidden check boxes.
- In the Report - Parameters dialog, go to the Available Values tab and select the From query radio button.
- Dataset: Genre
- Value field: GenreIDInt
- Label field: GenreID
- Go to the Default Values tab and select the From query radio button.
- Dataset: Genre
- Value field: GenreIDInt
- Click OK to close the dialog and add the parameter to the collection.
Design Report Layout
-
Add List data region
- From the toolbox, drag a List data region onto the design surface of the report.
- To display the controls placed inside the list to display in a columnar layout, go to the Properties panel to set the properties of the List data region as follows:
- DataSetName: Genre
- RowsOrColumnsCount: 5
-
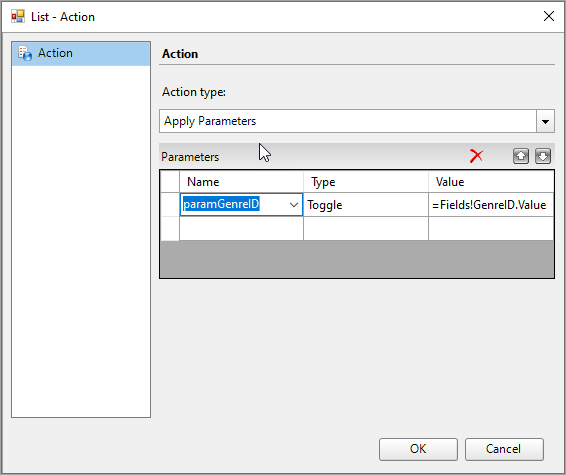
Add Apply Parameters Action on the List data region
- Go to the Action property and click the ellipses to open the List - Action dialog.
- Select 'Apply Parameters' option and set the following values:
- Name: paramGenreID
- Type: Toggle
- Value: =Fields!GenreID.Value
- Click OK in the List - Action dialog.
Add Controls onto the List Data Region
- Drag and drop the TextBox control onto the List data region and bind it to the =Fields!GenreName.Value field.
- Drag and drop the CheckBox control onto the List data region, to the left of the TextBox and set its Checked property to the following expression:
=IndexOf(Parameters!paramGenreID.Value, Fields!GenreIDInt.Value)>-1.
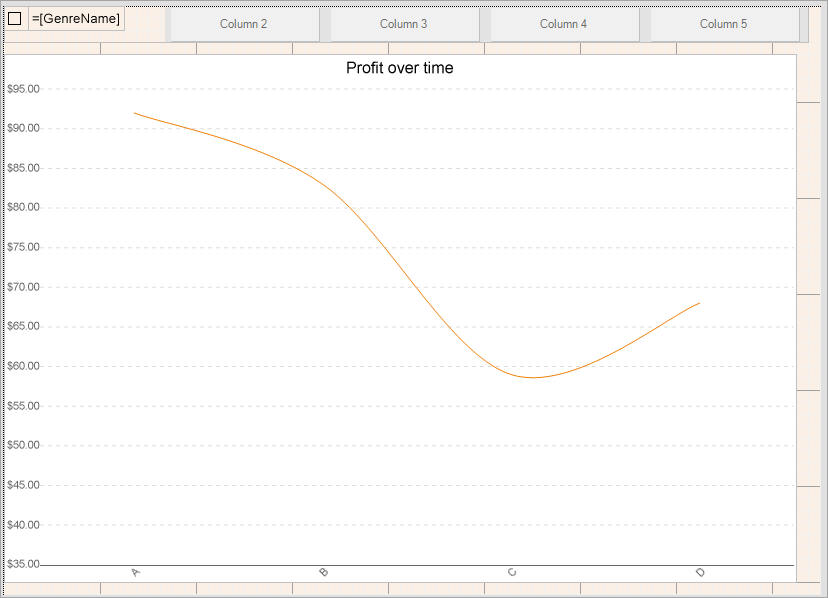
Add Chart Data Region
Let us create a chart that shows the total profit over a period of time. Refer Create Single Line Chart tutorial to visualize the data in a single line chart.
- Drag and drop the Chart data region onto the design area, below the List data region. The Chart Wizard dialog appears with an option to select the data and the chart type.
- Select the Dataset Name as 'SalesByGenre' and the Chart Type as 'Line'.
- Click Next to proceed. Here, you need to specify the line settings. We will define a data series value to display the profit values along the horizontal axis.
| Field |
Aggregate |
| =[Profit] |
Sum |
- In Choose Data Categories, set Field to =[SaleDate] and Sort Direction to 'Ascending'. We will add more customizations to the category in later steps.
- Click Next to preview your chart.
- Click Finish to complete adding the Chart.
- Expand the width of the Chart control to the width of the List data region in the design area by dragging the side marker.
- From the Report Explorer, select 'Plot - Plot1' node and set the LineAspect property to 'Spline'.
- Select the chart's X-Axis and from the Properties Panel, set the Labels > Format to 'd' to denote date and the Labels > LabelsAngle to '-45'.
- Select the chart's Y-Axis and from the Properties Panel, set the Labels > Format to 'c' to denote currency.
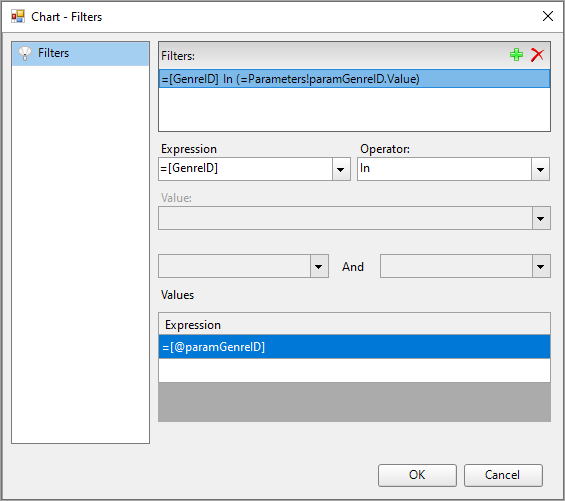
Add Filter to the Chart Data Region (Cross Filter)
- From the Report Explorer, select 'Chart'.
- Go to the Filters property and click the ellipses to open the Chart - Filters dialog.
- In the Chart - Filters dialog, click the Add (+) icon to add a filter for the chart.
- Expression: =Fields!GenreID.Value
- Operator: In
- Values > Expression: =Parameters!paramGenreID.Value.
- Click OK.
Customize Report Appearance
You can do some customizations on the report, especially on the chart using the smart panels. For chart customization, refer the 'Set Advanced Customization' section in the Create Single Line Chart tutorial.
Preview Report
The final report is shown at the beginning of this page. Note that the preview shown is in WebDesigner preview (similar to JSViewer). Ensure that you add System.Data.SQLite or System.Data.SQLite.Core nuget package and add the ActiveReports.config file to your project. See Configure ActiveReports for more information.
See Also