Calculations using DAX
DataViewsJS supports using the Data Analysis Expression (DAX) language to perform the calculations. DAX is a formula language that allows custom calculations. It includes various functions that are used in Excel formulas. DAX also provides additional functions that are designed to work with aggregates.
This topic covers the following calculation types:
- Calculated Columns
- Calculated Field
- Column Aggregator
Calculated Columns
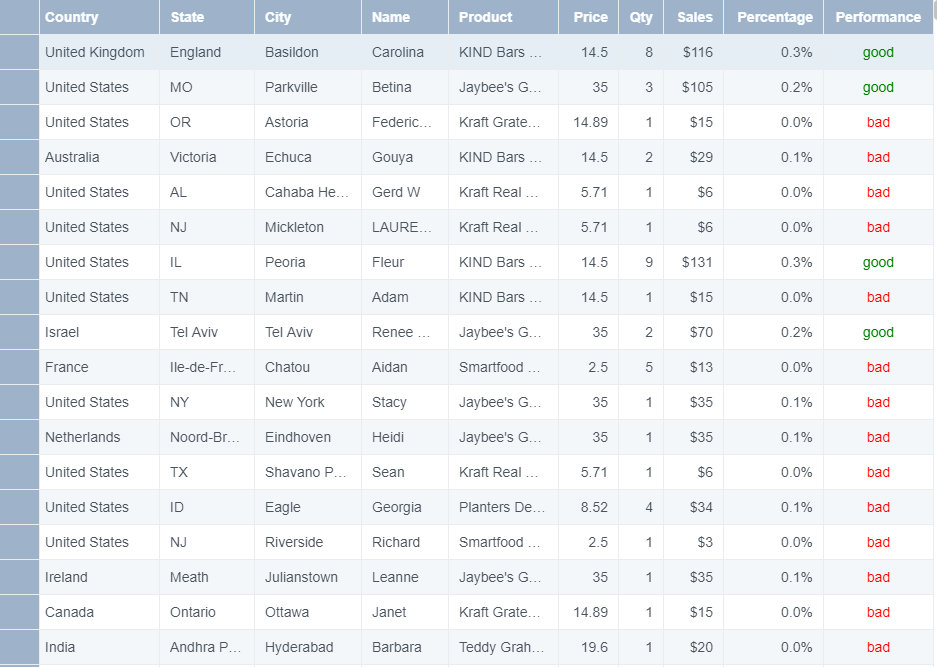
In DataViewsJS, you can add calculated columns to the data view. A calculated column includes an expression as a value for its data field. The expression starts with an '=' sign and the result is evaluated at run time.
The expressions in the calculated column can have functions like SUM, AVERAGE, COUNTROWS, or FILTER. The expressions can also refer to existing data columns or other calculated columns by referring to the column id within [], such as, SUM([ColumnId]).
Use the following steps to work with calculated columns.
Sample Code
- While adding the column definition, specify the expression for the calculated columns. Expressions can be added in the datafield option. The format in which column values are calculated is specified in the format option.
var cols = [
  {
    id: 'salesPercentage',
    caption: 'Percentage',
    dataField: '=[sales] / sum([sales])',
    format: '0.0%',
    cssClass: 'align-right',
    allowEditing: false,
    minWidth: 100,
  },
  {
    id: 'performance',
    caption: 'Performance',
    dataField: '=if([sales] > 50, "good", "bad")',
    presenter: '<span style="color: \{{? it.performance=="good"}}green\{{??}}red\{{?}}">\{{=it.performance}}</span>',
    width: 110,
    allowEditing: false,
  },
];
- Initialize the code by calling the Grid ID from the DIV tag.
var dataView = new GC.DataViews.DataView(
  document.getElementById('grid1'),
  data,
  columns,
  new GC.DataViews.GridLayout()
);
Calculated Field
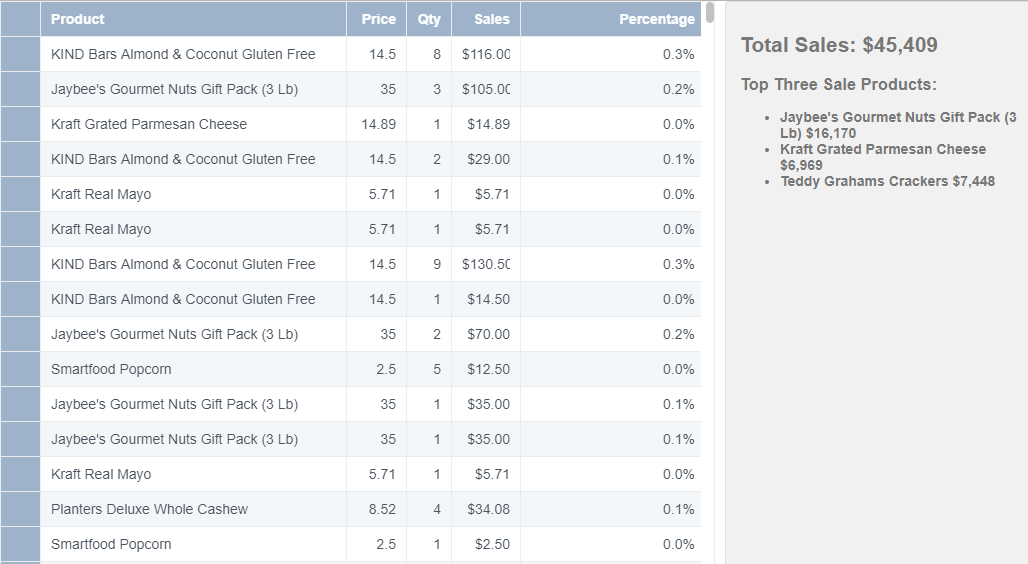
Using DataViewsJS, you can create calculated fields and display them outside the primary data view. Calculated fields are pre-defined named formulas that can be placed anywhere on the page.
Note: Calculated fields and calculated columns are similar since both are formula based, but they differ in terms of usage. Calculated columns treat the calculated results of a formula in a single column, where as the calculated fields define a formula that can be used anywhere on the page.
Use the following steps to implement the calculated field.
Sample Code
- Define an inner wrapper class to place the display box for the calculated field.
<div class="wrapper">
  <div id="grid1" class="grid"></div>
  <div class="result">
    <div class="inner-wrapper">
      <h2 id="totalSales"></h2>
      <h3>Top Three Sale Products:</h3>
      <ul id="topSales"></ul>
    </div>
  </div>
</div>
- Add the column definition and then initialize the code by calling the Grid ID from the DIV tag.
var columns = [
  {
    id: 'product',
    caption: 'Product',
    dataField: 'Product',
    width: 280,
    allowEditing: false,
  },
  {
    id: 'price',
    caption: 'Item Price',
    dataField: 'Price',
    dataType: 'number',
    allowEditing: false,
  },
  {
    id: 'quantity',
    caption: 'Quantity',
    dataField: 'Quantity',
    dataType: 'number',
    width: 60,
  },
  {
    id: 'sales',
    caption: 'Sales',
    dataField: '=[price]*[quantity]',
    dataType: 'number',
    format: '$#,##0.00',
    width: 180,
  },
  {
    id: 'salesPercentage',
    caption: 'Percentage',
    dataField: '=[sales] / sum([sales])',
    format: '0.0%',
    cssClass: 'align-right',
    allowEditing: false,
    minWidth: 120,
  },
];

var dataView = new GC.DataViews.DataView(
  document.getElementById('grid1'),
  data,
  columns,
  new GC.DataViews.GridLayout({
    allowEditing: true,
  })
);
dataView.data.addCalculatedField('totalSales', 'SUM([sales])', true);
var excelFormatter = new GC.DataViews.Formatter.ExcelFormatter(currencyFormat);

refresh();
dataView.editing.addHandler(function (sender, args) {
  if (args.status == 'endEditing') {
    refresh();
  }
});
- Add a function to update the results in the calculated box based on the column values.
function refresh() {
  var totalSales = dataView.data.getCalculatedFieldValue('totalSales');
  $('#totalSales').prop(
    'innerHTML',
    'Total Sales: ' + '<span style="font-weight:bold">' + excelFormatter.format(totalSales) + '</span>'
  );

  var top3Items = dataView.data.evaluate(
    'TOPN(3, summarize([product], "salesSubtotal", sum([sales])), [salesSubtotal])'
  );

  var ul = document.getElementById('topSales');
  var fragment = '';
  for (var i = 0, len = top3Items.length; i < len; i++) {
    fragment +=
      '<li style="font-weight:bold">' +
      top3Items[i]['product'] +
      ' ' +
      excelFormatter.format(top3Items[i]['salesSubtotal']) +
      '</li>';
  }
  $(fragment).appendTo($(ul).empty());
}
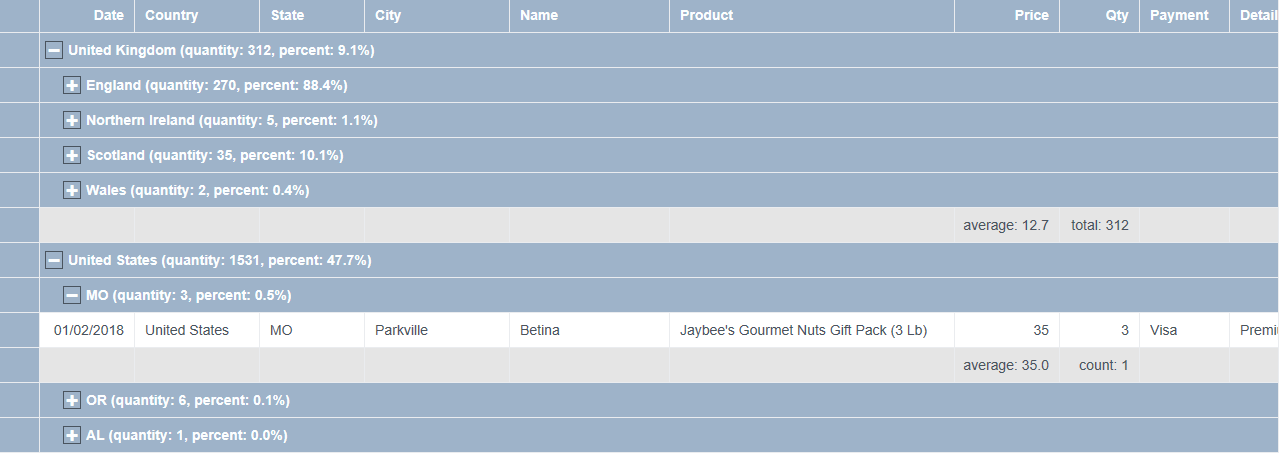
Column Aggregator
DataViewsJS allows you to set an aggregator formula for the columns in the group header or footer while grouping.
Steps to implement aggregate formulas are as follows:
Sample Code
- Add the column definition and specify the groupHeader and groupFooter properties to include the aggregator expressions. groupHeader: The Country and State columns are grouped and contains aggregate formulas in their headers using the groupHeader property. groupFooter: The Item Price and Quantity columns have aggregate formulas set in their footers using the groupFooter property.
var columns = [
  {
    id: 'id',
    caption: 'Order Id',
    dataField: 'Transaction_Id',
    dataType: 'number',
    visible: false,
  },
  {
    id: 'date',
    caption: 'Date',
    dataField: 'Transaction_Date',
    dataType: 'date',
    format: 'mm/dd/yyyy',
  },
  {
    id: 'country',
    caption: 'Country',
    dataField: 'Country',
    width: 180,
    groupHeader:
      'quantity: \{{=it.eval("=sum([quantity])")}}, percent: \{{=it.eval("=sum([quantity]*[price]) / sumx(GROUP.PARENT(), [quantity]*[price])", "0.0%")}}',
  },
  {
    id: 'state',
    caption: 'State',
    dataField: 'State',
    width: 120,
    groupHeader:
      'quantity: \{{=it.eval("=sum([quantity])")}}, percent: \{{=it.eval("=sum([quantity]*[price]) / sumx(GROUP.PARENT(), [quantity]*[price])", "0.0%")}}',
  },
  {
    id: 'city',
    caption: 'City',
    dataField: 'City',
    width: 120,
  },
  {
    id: 'name',
    caption: 'Name',
    dataField: 'Name',
    width: 120,
  },
  {
    id: 'product',
    caption: 'Product',
    dataField: 'Product',
    width: 280,
  },
  {
    id: 'price',
    caption: 'Item Price',
    dataField: 'Price',
    dataType: 'number',
    groupFooter: 'average: \{{=it.eval("=average([price])")}}',
  },
  {
    id: 'quantity',
    caption: 'Quantity',
    dataField: 'Quantity',
    dataType: 'number',
  },
  {
    id: 'paymentType',
    caption: 'Payment',
    dataField: 'Payment_Type',
  },
  {
    id: 'detail',
    caption: 'Detail',
    dataField: 'Product_Detail',
    width: '*',
  },
];
- Initialize the code by calling the Grid ID from the DIV tag. Specify the grouping property and set the collapsed or expanded property for the fields.
var dataView = new GC.DataViews.DataView(
  document.getElementById('grid1'),
  data,
  columns,
  new GC.DataViews.GridLayout({
    grouping: [
      {
        field: 'country',
        collapsed: false,
        footer: {
          columns: [
            {
              id: 'quantity',
              groupFooter: 'total: \{{=it.eval("=sum([quantity])")}}',
            },
          ],
        },
      },
      {
        field: 'state',
        collapsed: true,
        footer: {
          columns: [
            {
              id: 'quantity',
              groupFooter: 'count: \{{=it.eval("=count([quantity])")}}',
            },
          ],
        },
      },
    ],
  })
);
See Also
Feedback
Submit and view feedback for