Version 1
Version 1
Adding Column Presenters
DataViewsJS allows you to apply presenters to column data to enhance the visual appearance of the grid. The column presenter definition uses doT.js syntax. The doT.js syntax is a fast and concise JavaScript template function with emphasis on performance. Learn more about doT.js at http://olado.github.io/doT/index.html.
Use the following steps to apply Checkbox and DataBar presenters to the grid columns.
Sample Code
These steps assume that you have already initialized the grid and defined the columns. See Creating a Basic Grid and Defining Columns for additional information.
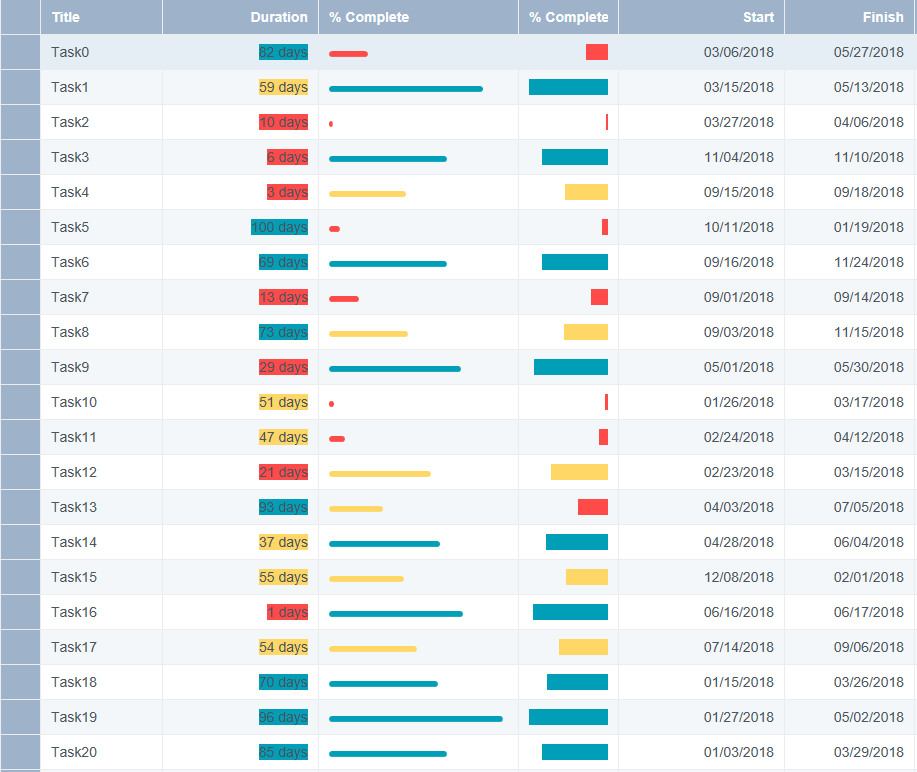
- Define a DataBar presenter variable for the % Complete column.
var percentCompleteColPresenter =
  '<span class="percent-complete-bar" style="background-color:\{{? it.percentComplete<30}}#FE4A49\{{?? it.percentComplete<60}}#FED766\{{??}}#009FB7\{{?}};width:\{{=it.percentComplete}}%;"></span>';
var percentCompleteColPresenter2 = '<span style="display:inline-block;width:\{{=it.percentComplete}}px;"></span>';
- Define a Checkbox presenter variable for the Billable column.
var booleanColPresenter = '<input type="checkbox" disabled="disabled" \{{? it.billable}}checked\{{?}} />';
- Specify both the DataBar and Checkbox presenters in the column definition array.
var columns = [
  {
    id: 'title',
    caption: 'Title',
    dataField: 'title',
  },
  {
    id: 'duration',
    caption: 'Duration',
    dataField: 'duration',
    presenter: durationPresenter,
    cssClass: getColClass,
  },
  {
    id: 'percentComplete',
    caption: '% Complete',
    dataField: 'percentComplete',
    presenter: percentCompleteColPresenter,
  },
  {
    id: 'percentComplete1',
    caption: '% Complete',
    dataField: 'percentComplete',
    presenter: percentCompleteColPresenter2,
    cssClass: getColClass,
    width: 100,
    allowResizing: false,
  },

  {
    id: 'start',
    caption: 'Start',
    dataField: 'start',
    format: 'mm/dd/yyyy',
    visible: !hiddenColumn,
  },
  {
    id: 'finish',
    caption: 'Finish',
    dataField: 'finish',
    format: 'mm/dd/yyyy',
    visible: !hiddenColumn,
  },
  {
    id: 'billable',
    caption: 'Billable',
    dataField: 'billable',
    presenter: booleanColPresenter,
    visible: !hiddenColumn,
  },
];
- Initialize the code by calling the grid ID from the DIV tag.
Feedback
Submit and view feedback for