Version 1
Version 1
Adding Multiple Column Headers
This feature allows you to group multiple column headers together. You can create a columnGroup by adding a composite column object in the column configuration. For example, {caption: 'header', columns: [col1,col2,col3] }. You can also set the headerGroupShow property for child columns of a columnGroup. The available values for the headerGroupShow property are,
- expanded: The child column is only shown when the group is expanded.
- collapsed: The child column is only shown when the group is collapsed.
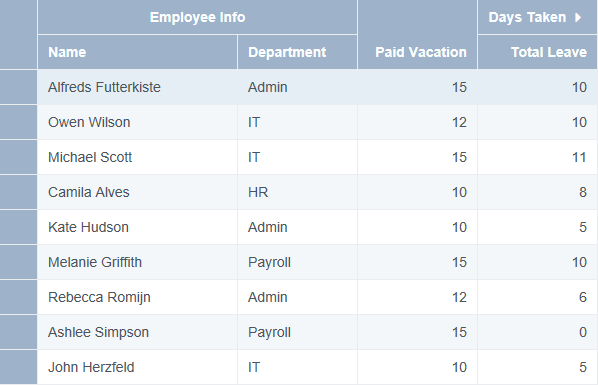
The following image displays the child columns under the Days Taken column in a collapsed state.
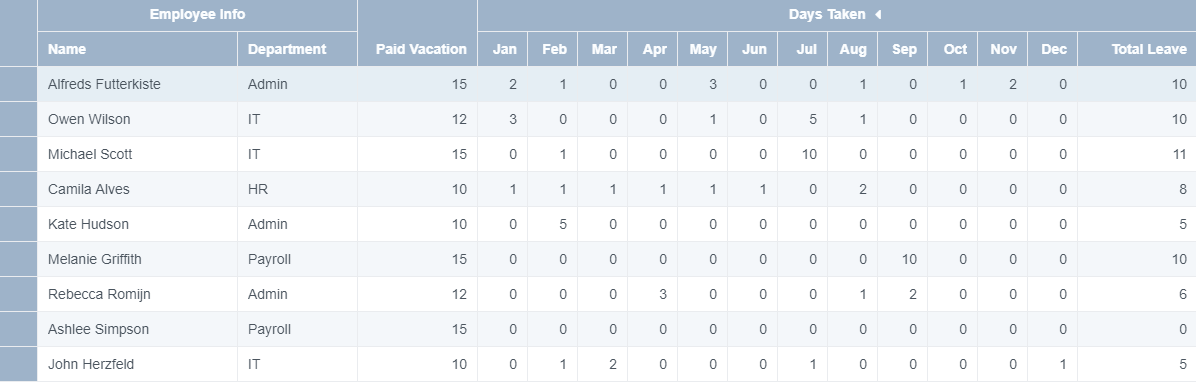
The following image displays the child columns under the Days Taken column in an expanded state.
Use the following steps to group multiple column headers.
Sample Code
- Define column configurations to add composite column groups. Also set the headerGroupShow property for the Days Taken column in the column definition. The child columns are visible if the headerGroupShow property is not set.
var columns = [
  {
    caption: 'Employee Info',
    columns: [
      {
        id: 'name',
        caption: 'Name',
        dataField: 'Name',
        width: 200,
      },
      {
        id: 'dept',
        caption: 'Department',
        dataField: 'Department',
        width: 120,
      },
    ],
  },
  {
    id: 'paidVacation',
    caption: 'Paid Vacation',
    dataField: 'PaidVacation',
    width: 120,
  },
  {
    caption: 'Days Taken',
    columns: [
      {
        id: 'Jan',
        caption: 'Jan',
        dataField: 'Jan',
        headerGroupShow: 'expanded',
        width: 40,
      },
      {
        id: 'Feb',
        caption: 'Feb',
        dataField: 'Feb',
        headerGroupShow: 'expanded',
        width: 40,
      },
      {
        id: 'Mar',
        caption: 'Mar',
        dataField: 'Mar',
        headerGroupShow: 'expanded',
        width: 40,
      },
      {
        id: 'Apr',
        caption: 'Apr',
        dataField: 'Apr',
        headerGroupShow: 'expanded',
        width: 40,
      },
      {
        id: 'May',
        caption: 'May',
        dataField: 'May',
        headerGroupShow: 'expanded',
        width: 40,
      },
      {
        id: 'Jun',
        caption: 'Jun',
        dataField: 'Jun',
        headerGroupShow: 'expanded',
        width: 40,
      },
      {
        id: 'Jul',
        caption: 'Jul',
        dataField: 'Jul',
        headerGroupShow: 'expanded',
        width: 40,
      },
      {
        id: 'Aug',
        caption: 'Aug',
        dataField: 'Aug',
        headerGroupShow: 'expanded',
        width: 40,
      },
      {
        id: 'Sep',
        caption: 'Sep',
        dataField: 'Sep',
        headerGroupShow: 'expanded',
        width: 40,
      },
      {
        id: 'Oct',
        caption: 'Oct',
        dataField: 'Oct',
        headerGroupShow: 'expanded',
        width: 40,
      },
      {
        id: 'Nov',
        caption: 'Nov',
        dataField: 'Nov',
        headerGroupShow: 'expanded',
        width: 40,
      },
      {
        id: 'Dec',
        caption: 'Dec',
        dataField: 'Dec',
        headerGroupShow: 'expanded',
        width: 40,
      },
      {
        id: 'total',
        caption: 'Total Leave',
        dataType: 'number',
        dataField: '=[Jan]+[Feb]+[Mar]+[Apr]+[May]+[Jun]+[Jul]+[Aug]+[Sep]+[Oct]+[Nov]+[Dec]',
        width: 120,
      },
    ],
  },
];
- Initialize the code by calling the grid ID from the DIV tag.
Feedback
Submit and view feedback for