Version 1
Version 1
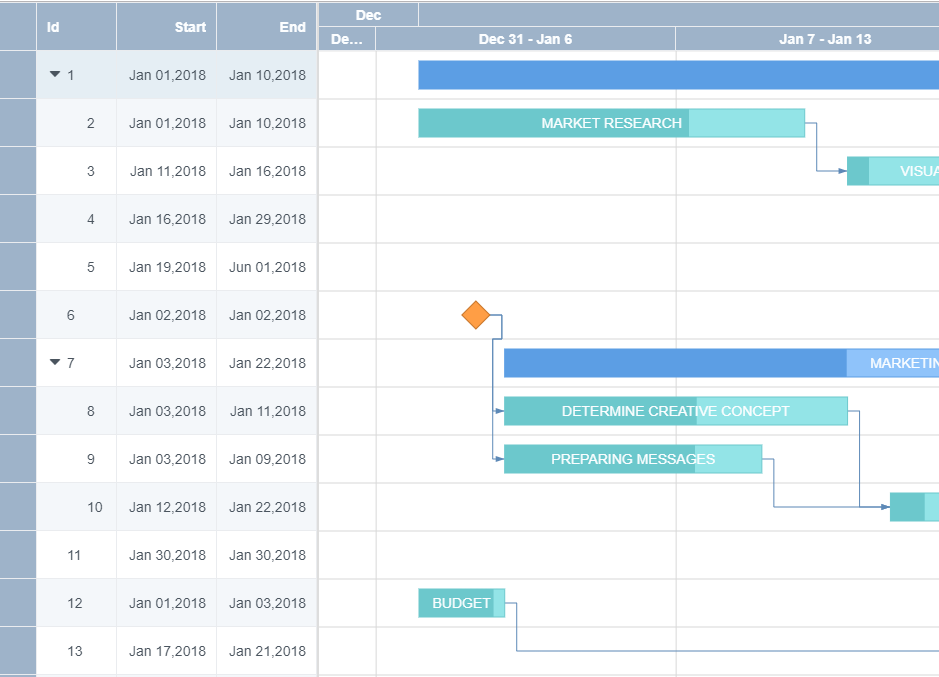
Gantt View
Use the gantt view grouping strategy to visually display hierarchical relationships. The gantt view provides a visual overview of the start and finish dates. It maintains the timescale based tasks and deliverables on a daily, weekly, monthly, or yearly basis.
Use the following steps to implement the gantt view grouping strategy.
Sample Code
These steps assume that you have already defined the custom styles and data. See Gantt View for additional information.
- Add the following references after the Dataview reference.
<link rel="stylesheet" href="[Your Script Path]/gc.dataviews.gantt.min.css" />
<script src="[Your Script Path]/gc.dataviews.gantt.min.js" type="text/javascript"></script>
<script src="data/ganttEvent.js" type="text/javascript"></script>
- Add a div tag within the body tag to include the DOM element as the container in the page.
<div id="grid1" style="height:100%"></div>
<template id="popupTemplate" style="display: none">
  <div class="dialog-body">
    <div>
      <div class="dialog-ids">
        <div class="dialog-header">start date:</div>
        <input type="date" class="dialog-content" data-column="start" />
      </div>
      <div class="dialog-ids" style="margin-left:40px">
        <div class="dialog-header">end date:</div>
        <input type="date" class="dialog-content" data-column="end" />
      </div>
    </div>
    <div class="dialog-header">description:</div>
    <textarea class="dialog-text" style="height:60px;font-style:italic;" data-column="description"></textarea>
    <div class="dialog-header">resources:</div>
    <textarea class="dialog-text" style="height:28px;" data-column="resources"></textarea>
  </div>
</template>
- Add the column definition.
var columns = [
  {
    id: 'id',
    caption: 'Id',
    dataField: 'id',
    width: 80,
  },
  {
    id: 'start',
    caption: 'Start',
    dataField: 'start',
    width: 100,
    dataType: 'date',
    format: 'mmm dd,yyyy',
  },
  {
    id: 'end',
    caption: 'End',
    dataField: 'end',
    width: 100,
    dataType: 'date',
    format: 'mmm dd,yyyy',
  },
  {
    id: 'gantt',
    ganttColumn: {
      timeLineScale: 'month',
      scale: 300,
      start: 'start',
      end: 'end',
      text: 'description',
    },
    width: '*',
  },
  {
    id: 'description',
    caption: 'Description',
    dataField: 'description',
    visible: false,
  },
  {
    id: 'resources',
    caption: 'Resources',
    dataField: 'resources',
    visible: false,
  },
  {
    id: 'predecessorID',
    caption: 'predecessorID',
    dataField: 'predecessorID',
    visible: false,
    allowEditing: false,
  },
  {
    id: 'parentID',
    caption: 'parentID',
    dataField: 'parentID',
    visible: false,
    allowEditing: false,
  },
];
- Initialize the code by calling the Grid ID from the DIV tag.
var dataView = new GC.DataViews.DataView(
  document.getElementById('grid1'),
  data,
  columns,
  new GC.DataViews.GridLayout({
    colHeaderHeight: 48,
    rowHeight: 48,
    allowEditing: true,
    editRowTemplate: '#popupTemplate',
    editMode: 'popup',
    hierarchy: {
      keyField: 'id',
      parentField: 'parentID',
      collapsed: false,
      column: 'id',
      footer: {
        visible: false,
      },
    },
  })
);
Feedback
Submit and view feedback for