Adding Group Page Breaks
To display each data group on a separate page, you need to sort the data and add page breaks for each group. Where you do this depends on the type of report you're using. Let's take a look at grouping in each report type.
Section Reports
In a Section report, setting the NewPage property of a GroupHeader section to Before causes the report to create a new page before rendering the group header, so that each group is rendered on a separate page. Setting this property to After, or setting this property on a GroupFooter section also puts each group on a separate page.  In addition to page breaks, there are other properties that you might find helpful in controlling how your groups render, such as KeepTogether, RepeatStyle, UnderlayNext, and GroupKeepTogether. For more information, see the recent blog article Page Break After N Records, and the following topics in our User Guide. Grouping Data in Section Reports | Add Grouping in Section Reports
Page Reports
How you add page breaks for each group in a Page report depends on how you group data and on what data region you use.
Grouping data on a fixed page
When you group data on a fixed page, the report adds page breaks automatically. This method works well when the report only has one data group. Here's how you add a data group on a fixed page.
- Select the report by clicking in the grey area around the page, and in the Properties window below the properties, click the Fixed Layout Settings command.
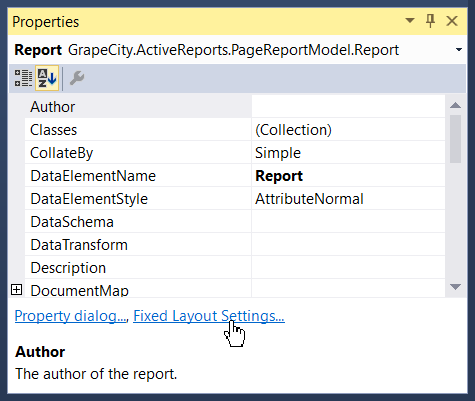 Note: If you don't see the command, right-click the Properties window and select the checkbox for the Command option.
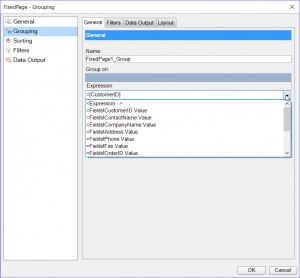
 - In the dialog that appears, select the Grouping page.
- Drop down the Group on expression to select the data field on which to group the page.


For more information on how to group data on a fixed page, see the Grouping in a Fixed Page topic in our User Guide.
Grouping data in a data region
To group data in a data region, set options in the Property settings dialog for the data region you use. Use this method when your report has more than one data group. For example, here's how you add page breaks for each data group in a Table control.
- Select the Table control and in the Properties window below the properties, click the Property dialog command.
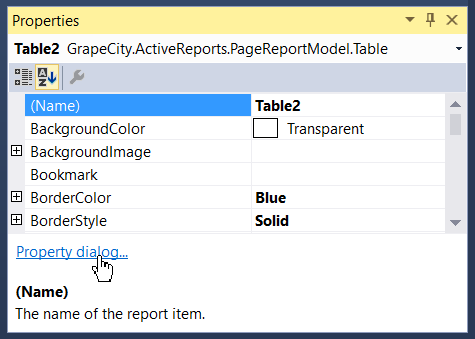 Note: If you don't see the command, right-click the Properties window and select the checkbox for the Command option.
 - In the dialog that appears, select the Groups page, then the Layout tab.
- Select the checkbox next to the Page break at end option.
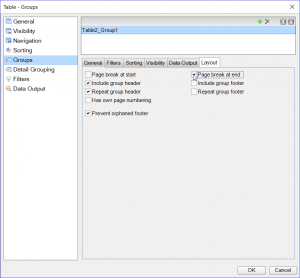


The Page break at start option also puts each group on a separate page. For more information on how to group data in your reports, see the following topics in our User Guide. Grouping Data (Page Layouts) | Grouping in a Data Region

MESCIUS inc.